Revista de la Facultad de Ciencias Agrarias. Universidad Nacional de Cuyo. Tomo 53(2). ISSN (en línea) 1853-8665. Año 2021.
Original article
Optimal plot size for experimentation of common beans (Phaseolus vulgaris L.) in the northern region of Minas Gerais, Brazil
Tamaño de parcela óptimo para la experimentación de frijoles (Phaseolus vulgaris L.) comunes en la región norte de Minas Gerais, Brasil
Bruno Vinícius Castro Guimarães 1*
Abner José de Carvalho 2
Ignacio Aspiazú 2
Liliane Santana da Silva 2
Rafael Rogério Pereira da Silva 2
Amanda Maria Leal Pimenta 2
Marielly Maria Almeida Moura 2
1 Instituto Federal de Educação, Ciência e Tecnologia do Amazonas. Setor de Agricultura. BR 37, km 03. Estrada do aeroporto. Bairro Cachoeirinha. IFAM. São Gabriel da Cachoeira-AM. CEP: 69.750-000.
2 Universidade Estadual de Montes Claros. Departamento de Ciências Agrárias. Av. Reinaldo Viana. 2630 - Janaúba, MG, 39.440-000.
Abstract
The objective was to estimate the optimal plot size for field experiments with the common bean (Phaseolus vulgaris L.) using the modified maximum curvature method. A uniformity trial was carried out with the cultivar BRSFC-402 sown at a spacing of 0.5 m between plant rows and 10 plants per meter within the row. Final bean stand, mean number of pods per plant, mean number of grain per pod, mean 100-grain weight, and grain yield were evaluated. Measurement were taken from 20 central rows measuring 20 m in length, totaling 4,000 plants on an area of 200 m2. A basic unit (0.5 m2) was a row containing 10 plants. Four hundred basic units were combined to form 14 plot shapes. The methods relative information and modified maximum curvature were used to define the optimal shape and size of plots, respectively, for experimental evaluation with the common bean. As the plot should be suitable for efficient evaluation of all evaluated characteristics, the optimal plot size consisted of five basic units (25 plants) and was shaped as five rows x one basic unit per row.
Keywords: Simulation; Experimental precisión; Experimental design; Phaseolus vulgaris L.
Resumen
El objetivo fue evaluar el tamaño mínimo de parcelas experimentales para el frijol común (Phaseolus vulgaris L.) utilizando el método de curvatura máxima modificado. El experimento consistió en una prueba de uniformidad en un suelo Latosol amarillo-rojo con la temporada de lluvias marcada por el verano con el cultivar BRSFC-402 sembrado a un espaciamiento de 0,5 m entre hileras de plantas y 10 plantas por metro dentro de la hilera. Para las mediciones se consideraron 20 hileras centrales de 20 m de longitud, totalizando 4.000 plantas en un área de 200 m². Se evaluó el rodal final de frijol, el número medio de vainas por planta, el número medio de granos por vaina, el peso medio de 100 granos y el rendimiento de grano. En las evaluaciones, cada fila con 10 plantas se consideró una unidad básica (0,5 m²), que asciende a 400 unidades básicas cuyas dimensiones se combinaron en 14 formas de parcela. Se utilizaron los métodos de información relativa y curvatura máxima modificada para obtener la mejor forma y el tamaño de parcela más apropiado, respectivamente, para la evaluación experimental con frijol común. Considerando que la parcela óptima debería permitir una evaluación eficiente de todas las características evaluadas, el tamaño de parcela apropiado fue de cinco UB (25 plantas) en el formato de cinco filas x una UB por fila.
Palabras clave: Simulación; Precisión experimental; Diseño experimental; Phaseolus vulgaris L.
Originales: Recepción: 06/05/2020
Aceptación: 03/05/2021
Introduction
Common bean (Phaseolus vulgaris L.) is widely grown in both small and large areas in Brazil, where it plays an important role socially, culturally and economically (22). Although initially recognized as a subsistence crop, common bean production has been growing; therefore, several techniques have been adopted in its cultivation, including irrigation (17), biostimulant (1), soil cover, genetic parameters (23) and improved crop practices (15).
Brazil, the third world’s largest producer of common beans, produced 3.3 million tons from 3.1 million hectares in 2017/2018, with an average yield of 1,043 kg ha-1 (9). As the crop is an important source of dietary protein, it plays a key role in food security. Accordingly, field experiments have been carried out across the country to test different cropping systems. Due to uneven soil and climate conditions, large experimental error is produced in field experiments, thereby decreasing the statistical power in verifying minimal significant differences between treatments.
The size of experimental plots may vary depending on the soil heterogeneity throughout the experimental area and intrinsic characteristics of each crop (12). Several aspects should be taken into account when determining the optimal plot size, such as crop type, number of treatments, technology, available land, and financial resources (30). Experimenters usually define the plot size based on site-specific conditions, available area or their personal research experience.
The plot size directly influences the experimental precision. Currently, plot sizes having four to six plant per row and measuring four to five meters long are used in most field studies with common beans. However, depending on the nature of the study, the number of experimental plots may be too large, so that field experimentation becomes virtually unfeasible. Smaller plot sizes may come as a solution but to the detriment of experimental precision.
Therefore, plot size and number of replicates should be optimally determined to obtain greater experimental precision (31). To do so, several methods have been used to determine the size and shape of the experimental plots. Among them, the Modified Maximum Curvature Method (MMCM) (20) stands out. This method algebraically determines through a regression equation the optimal relationship between plot sizes and their respective coefficients of variation (27). With this model, one can minimize experimental error, optimize resources, and ensure maximum precision (8).
The objective of this work was to estimate, using the Modified Maximum Curvature Method, the optimal plot size for determining yield components and the final plant stand of the common bean, with the aim of optimizing the use of resources without compromising the reliability of data obtained from experiments with this legume in the northern region of Minas Gerais, Brazil.
Material and methods
The study was conducted at the Experimental Farm of the Universidade Estadual de Montes Claros (UNIMONTES), located in the municipality of Janaúba, northern Minas Gerais state, Brazil (15° 48’ 32”S, 43° 19’ 3”W, and altitude of 533 m). The region’s climate is Aw type, which corresponds to rainy summers and dry winters, according to the Köppen’s classification. In the experimental area, the soil was classified as yellow-red Latosol (Ferralsols, WRB / FAO; Oxisols, Soil Taxonomy). The rainy season is normally marked by long dry spells in the middle of the season, followed by intense heat (25-35°C), strong sunlight and low relative humidity.
The experiment consisted of a uniformity trial with the cultivar BRSFC-402 sown at a spacing of 0.5 m between plant rows and 10 plants per meter within the row. Twenty 20-m-long central rows were considered for measurements, totaling 4,000 plants on an area of 200 m2.
We evaluated grain yield (kg ha-1), measured with a field scale and corresponding to the total mass of grains per basic unit (BU); final plant stand (FS), given by different BU combinations; mean number of pods per plant (NPP), obtained by direct counting; mean number of grains per pod (NGP), and mean 100-grain weight (M100). Number of grains per pod and M100 were estimated using a sample of five plants within each BU.
At harvest, the number of beans (grains) per plant in each BU was counted to allow the estimation of the final stand (FS). Then, results were converted to number of grains per hectare. The plants harvested in each BU were identified and taken to the laboratory, where the total number of pods of these plants was counted to estimate the average number of pods per plant (NVP).
The pods were threshed and the beans were counted to estimate the average number of grains per pod (NGP) by dividing the total number of grains by the total number of pods of each BU. The 100-grain weight (M100) was estimated by weighing three samples containing 100 beans collected from each BU, which were corrected to 13% humidity. Grain yield was estimated by weighing all the beans produced in each BU, and results were expressed as kg ha-1 and corrected to 13% humidity.
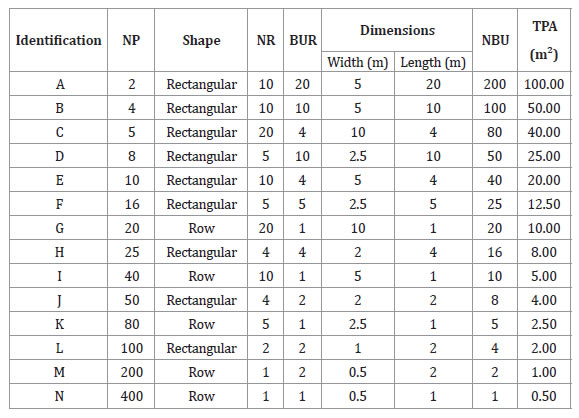
For each evaluated characteristic, we considered only BU arrangements that allowed plants to cover the entire experimental area. Thus, the basic units were combined in 36 plot sizes and 14 plot shapes with the largest relative information (RI) for the same BU size. The RI model considers the effect of the plot shape - width and length - on experimental precision. Thus, 14 plot sizes were obtained by combining BUs to form rectangular plots along the crop rows (Table 1).
Table 1: Number of plots (NP), plot shape, number of rows (NR), number of basic units per row (BUR), number of basic units (NBU) and total plot area (TPA).
Tabla 1: Número de parcelas (NP), formato, número de filas (NR) y de unidades básicas por fila (BUR), número de unidades básicas (NBU) y área de parcela total (TPA).
Using the Modified Maximum Curvature Method (MMCM), adapted by Meier & Lessman (1971), the point of maximum curvature or optimal plot size was determined by a potential regression equation.
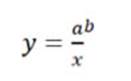 (1)
(1)
where:
y = coefficient of variation,
x = plot size in basic units and a and b are constants of the model.
The point of maximum curvature was estimated by the following equation:
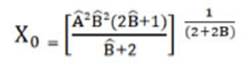 (2)
(2)
where:
X0 = value of the abscissa corresponding to the point of maximum curvature, i.e. = the estimator of the optimal plot size
 and B̂ = the respective estimates of A and В, which are constants of the equation.
Relative information is determined in percentage by the ratio of variances: the variance of the plot composed of one BU (V1) and the comparable variance (Vc) obtained by dividing the variance by its corresponding plot size in BU (19).
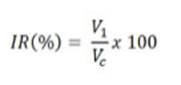 (3)
(3)
Using the RI method, we initially considered the variance of grain yield, FS, NPP, NGP and M100, between the X BU areas of each plot shape defined on the experimental field:
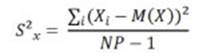 (4)
(4)
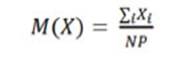 (5)
(5)
where:
Xi = the studied variable of the i-eth plot,
M = the mean of the variable measured in the plots with a size of X BUs; and NP is the number of plots with a size of X BUs.
Statistical analyzes to determine plot sizes by MMCM were built using Excel® based on a routine proposed by Donato et al. (2008, 2018). The models were selected according to the significance of the coefficients and the highest coefficients of variation and adjusted coefficients of variation, obtained through the analysis of variance and the t test in the R software (10). To determine plot shapes by the relative information method, simulation routines were built and run on Excel®.
Results and discussion
Of 36 tested plot shapes, 14 having greater relative information (RI) were selected. Therefore, the shapes and their respective RIs were determined for final plant stand, grains per pod, 100-grain weight, number of pods per plant, and yield.
Changes in relative information are not directly related to plot size in basic units, but rather to the shape of the plot (31). Due to the way the method works, the plot shaped as 1 R x 1 BU/R has the largest relative information for all analyzed variables and is used as reference (Table 2).
Table 2: Variables anallyzed for the shape of the plot for experimental evaluations with common bean.
Tabla 2: Variables analizadas para la forma de la parcela para evaluaciones experimentales con frijol común.
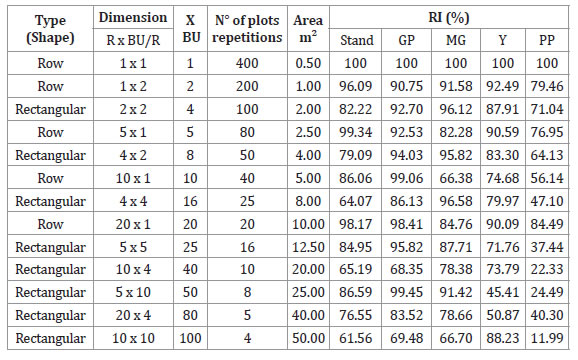
Plot shape (row or rectangular), dimensions (row and basic unit per row), number of basic units (BUs), number of plots (NP), plot area and relative information (%) with various shapes for stand, grains per pod (GP), 100-grain weight (MG), yield (Y) and pods per plant (PP).
Formato de trazado (fila o rectangular), dimensiones (fila y unidad básica por fila), número de unidades básicas (BU), número de trazado (NP), área de trazado e información relativa (%) con varios formatos para soporte, granos por vaina (GP), masa de 100 granos (MG), rendimiento (Y) y vainas por planta (PP).
Therefore, based on results presented in Table 2, the 5 R x 1 BU/R plot shape, with five BUs, ensures RI values closer to 100% for all studied variables, so this plot shape is the most suitable for field experiments with the common bean.
By grouping the 14 plot sizes, the lowest and highest coefficients of variation (CV) were associated with the combinations with the largest and lowest number of BUs, respectively (Table 3).
Table 3: Common bean yield evaluation in a 400 BU uniformity test (1 BU = 0,5 m²).
Tabla 3: Evaluación del rendimiento del frijol común en una prueba de uniformidad de 400 BU (1 BU = 0,5 m²).
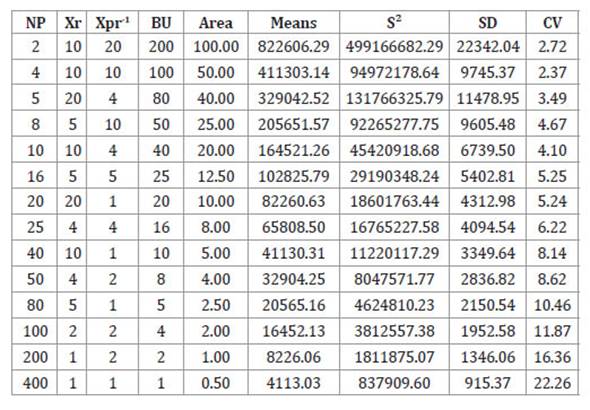
Number of plots (NP), with sizes (rows (Xr) × basic units per rows (Xpr-1), basic units (BU), area (m²) and respective estimates of means (m), variance (s²), standard deviation (SD) and coefficient of variation (CV).
Número de parcelas (NP), con tamaños (filas (Xr) × unidades básicas por filas (Xpr-1), unidades básicas (BU), área (m²) y estimaciones respectivas de medias (m), varianza (s²), desviación estándar (DE) y coeficiente de variación (CV).
The relationship between these quantities tends to be inversely proportional because larger plots usually correlate negatively with lower coefficients of variation. An inverse relationship may occur on highly heterogeneous soils or with the use of unstable plant material; in both cases, large plots may produce high coefficients of variation (12).
In field trials, CV indicates experimental precision. Plot sizes with lower CVs are recommended for experimental purposes (8). The inverse behavior between plot size (BU) and coefficient of variation (Table 3) has also been found in several similar studies (4, 8, 27, 30).
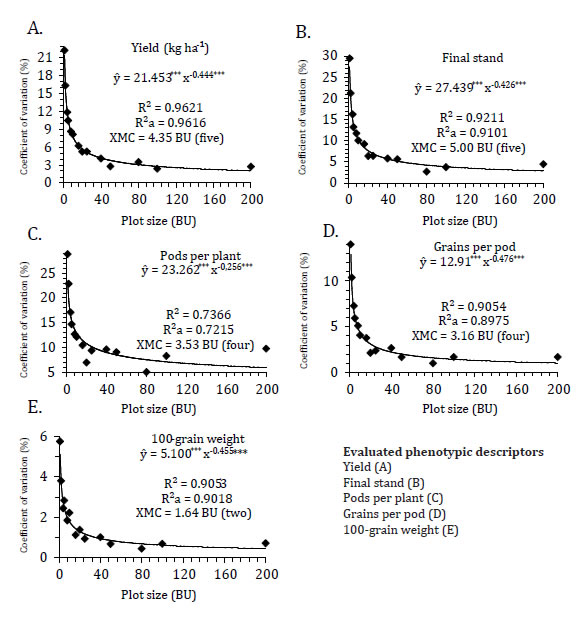
Figure 1 depicts the relationship between the coefficient of variation and plot size in BU.
*** Significant at a 0% level of significance (p < 0.001).
*** Significativo a un nivel de significancia de 0% (p <0,001).
Figure 1: Graphical representation between coefficient of variation (CV) and plot size in basic unit (BU) to estimate optimal plot size (XMC) of yield (A), final plant stand (B), pods per plant (C), grains per pod (D) and 100-grain weight (E) for the common bean.
Figura 1: Representación gráfica entre el coeficiente de variación (CV) y el tamaño de la parcela en la unidad básica (BU) para estimar el tamaño óptimo de la parcela (XMC) de productividad (A), soporte (B), vainas por planta (C), granos por vaina (D) y masa de 100 granos (E) para frijol común.
The highest estimates of the optimal plot sizes or maximum curvature point (XMC) were associated with yield (Figure 1A) and final plant stand (Figure 1B), both having five BUs, followed by the number of pods per plant (Figure 1C), number of grains per pod (Figure 1D) and 100-grain weight (Figure 1E), with approximate plot sizes of four, four and two BUs, respectively.
The coefficient of determination of optimal plot sizes ranged from 0.7366 to 0.9621 for the common bean’s evaluated phenotypic descriptors (Figure 1), with the best fit associated with yield (Figure 1A), followed by final stand (Figure 1B), 100-grain weight (Figure 1E), beans per pod (Figure 1D) and pods per plant (Figure 1C). The coefficients of determination were high enough to ensure adequate precision in defining the plot size.
Using the MMCM, Santos et al. (2015) determined different plot sizes for sunflower and reported R2 values ranging from 0.8806 to 0.9648 for optimal plot sizes. With this same estimator, R2, Cargnelutti Filho et al. (2018) identified the optimal plot size (Xo, in m²) with a coefficient of 0.9989 to assess fresh mass of turnips. For experimental evaluation of cactus pear, cv. Gigante, Guimarães et al. (2019) determined different plot sizes with R² between 0.8082 and 0.9352. These results reaffirm the high adjustment quality of MMCM.
Appropriate plot sizes varied with respect to the evaluated characteristics, with estimates of Xo and X falling between 1.64 and 5.00 and two and five BUs, respectively (Figure 1). The smallest estimated plot size was associated with the 100-grain weight (2 BUs), followed by pods per plant and grains per pods (4 BUs), and by yield and final plant stand (5 BUs) (Figure 1). The MMCM, besides estimating the optimal plot size determined by the critical level, also presents intermediate sizes, as found in several studies (6, 16, 18, 28).
Nevertheless, keeping reducing the coefficient of variation beyond the critical point is not beneficial to experimental precision, because, from the point of maximum curvature on, the coefficient of variation assumes a linear behavior (28).
The use of suboptimal or divergent plots may result in low experimental precision, higher experimental errors and high operational cost (3, 5, 8 13, 14, 25). In this study, depending on the investigated agronomic trait, plot size ranged from two to five BUs for field trials with the common bean. Similar results for the same crop was reported in the state of Mato Grosso, Brazil, with 3 m² or 60 plants (29).
Studies with common bean have been developed with plots of various sizes, with areas of 24 m² (4), 100 m² (21), 72 m² (26) and 24 m² (2). These plot sizes are defined based on factors including available resources, the researcher’s experience, and limitations on the experimental area. However, 5 m² plots ensure significant precision for experimental evaluation, thereby optimizing agricultural inputs and human resources. Thus, in line with the results obtained in this work, the experimental area can be optimized with significant reduction in plot size.
Field experiments with the common bean should be designed with five BUs, because all traits evaluated in this work are measured together. Moreover, the modified maximum curvature method, despite being a procedure with algebraic determination (7), tends to estimate smaller plots when compared to other methods (12, 32). By following this statistical recommendation, the experimenter will gain efficiency in the use of resources without compromising the reliability of collected data.
Conclusions
Yield and final plant stand require larger plot sizes to be evaluated with higher experimental precision. For experimental evaluation of common beans involving grain yield and its primary components (final stand, number of pods per plant, number of grains per pod and 100- grain weight), the plot size should be composed of five basic units in the northern region of Minas Gerais, Brazil.
The plot shape of five-rows x one BU/row, with five BU, ensures relative information values closer to 100% for all evaluated variables. This shape is suitable for experimental purposes with the common bean in the northern region of Minas Gerais, Brazil.
1. Bossolani, J. W.; Sá, M. E.; Merloti, L. F.; Bettiol, J. V. T.; Oliveira, G. R. F.; Pereira, D. S. 2017. Bioestimulante vegetal associado a indutor de resistência nos componentes da produção de feijoeiro. Revista Agro@mbiente. 11 (4):307-314. http://dx.doi.org/10.18227/1982- 8470ragro.v11i4.4094
2. Braga, M. P.; Rezende, L. M.; Estrela, L. M. B.; Lemes, N. M.; Rietjens, A. R.; Oliveira, A. L. L.; Silva, J. M.; Silva, L. L. A.; Paz-Lima, M. L. 2019. Incidence of base rot and wilt sanitary severity and influence about seed pathology by cultivars of common bean (Phaseolus vulgaris). Plant Pathology/Scientific Article. 86(1): 1-12. http://dx.doi.org/10.1590/1808- 1657000112018
3. Brioschi Junior, D.; Guarçoni, R. C.; Alixandre, F. T.; Pereira, L. L.; Sousa, D. G. de; Marcate, J. P. P.; Favarato, L. F.; Sousa, L. H. B. P. de; Fornazier, M. J.; Filete, C. A. 2020. Tamanho ótimo de parcela experimental para avaliar características físico-químicas de café Árabica. Revista Ifes Ciência. Brasil. 6(3): 03-11. https://ojs.ifes.edu.br/index.php/ric/article/view/857/567
4. Brito, L. F.; Pacheco, R. S.; Souza Filho, B. F.; Ferreira, E. P. B.; Straliotto, R.; Araújo, A. P. 2015. Resposta do Feijoeiro Comum à Inoculação com Rizóbio e Suplementação com Nitrogênio Mineral em Dois Biomas Brasileiros. Revista Brasileira de Ciência do Solo. 39 (1): 981-992. http:// dx.doi.org/10.1590/01000683rbcs20140322
5. Brum, B.; Brandelero, F. D.; Vargas, T. de O.; Storck, L.; Zanini, P. P. G. 2016. Tamanho ótimo de parcela para avaliação da massa e diâmetro de cabeças de brócolis. Revista Ciência Rural. 3(46): 447-463. http://dx.doi.org/10.1590/0103-8478cr20150236
6. Cargnelutti Filho, A.; Toebe, M.; Burin, C.; Casarotto, G.; Alves, B. M. 2014. Planejamentos experimentais em nabo-forrageiro semeado a lanço e em linha. Bioscience Journal. 3(30): 677-686. http://www.seer.ufu.br/index.php/biosciencejournal/article/view/18048
7. Cargnelutti Filho, A.; Storck, L.; Lúcio, A. D.; Toebe, M.; Alves, B. M. 2016. Tamanho de unidades experimentais básicas e tamanho ótimo de parcelas para nabo-forrageiro. Pesquisa Agropecuária Brasileira. 4(51): 309-319. http://dx.doi.org/10.1590/S0100- 204X2016000400003
8. Cargnelutti Filho, A.; Araujo, M. M.; Gasparin, E.; Foltz, D. R. B. 2018. Dimensionamento amostral para avaliação de altura e diâmetro de plantas de timbaúva. Revista Floresta e Ambiente. 1(25): 1-9. http://dx.doi.org/10.1590/2179-8087.121314
9. CONAB - Companhia Nacional de Abastecimento. Acompanhamento da safra brasileira. Brasília: Conab. 2018. 5(5): 140p. http://www.conab.gov.br>. Acesso em: 22.jul.2019.
10. Development Core Team. 2018. R: A language and environment for statistical computing. R Foundation for Statistical Computing. Vienna, Austria. https://www.R-project.org/
11. Donato, S. L. R.; Siqueira, D. L.; Silva, S. de O.; Cecon, P. R.; Silva, J. A. da; Salomão, L. C. C. 2008. Estimativas de tamanho de parcelas para avaliação de descritores fenotípicos em bananeira. Pesquisa Agropecuária Brasileira. 8(43): 957-969. http://dx.doi.org/10.1590/ S0100-204X2008000800003
12. Donato, S. L. R.; Silva, J. A. da; Guimarães, B. V. C.; Silva, S. de O. 2018. Experimental planning for the evaluation of phenotipic descriptors in banana. Revista Brasileira de Fruticultura. 5(40): 1-13. http://dx.doi.org/10.1590/0100-29452018962
13. Faria, G. A.; Costa, T. F.; Felizardo, L. M.; Lopes, B. G.; Oliveira, C. P. M. de; Lima, J. F. de; Fonseca, A. D. da.; Rocha, P. S; Peixoto, A. P. B; Oliveira, T. A. de. 2020a. Plateau regression in estimating the optimal plot size in papaya experiments in a greenhouse. Research, Society and Development. 9(10): 1-16. https://www.rsdjournal.org/index.php/rsd/article/view/9289
14. Faria, G. A.; Lopes, B. G.; Peixoto, A. P. B.; Ferreira, A. F. A.; Maltoni, K. L.; Pigari, L. 2020b. Experimental plot size of passion fruit. Revista Brasileira de Fruticultura. 42(1): 1-7. http://dx.doi.org /10.1590/0100-29452020125
15. Forte, C. T.; Galon, L.; Beutler, A. N.; Perin, G. F.; Pauletti, E. S. S.; Basso, F. J. M.; Holz, C. M.; Santin, C. O. 2018. Coberturas vegetais do solo e manejo de cultivo e suas contribuições para as culturas agrícolas. Revista Brasileira de Ciências Agrárias. 13(1): e5501. in: http://dx.doi. org/10.5039/agraria.v13i1a5504
16. Guarçoni, R. C.; Souza, J. L.; Favarato, L. F.; Angeletti, M. P.; Bahiense, D. V. 2017. Determinação do tamanho ótimo de parcela experimental para experimentos com repolho utilizando simulação e métodos de estimação. Revista Científica Intelletto. 2(2): 79-87. http://dx.doi. org/10.17648/intelletto-2525-9075-v2-n2-09
17. Guerra, C.; Robaina, A. D.; Peiter, M.; Parizi, A. R. C. 2018. Desenvolvimento vegetativo do feijoeiro irrigado com diferentes lâminas. Revista Brasileira de Agricultura Irrigada. 12(2): 2406- 2417. http://dx.doi.org/10.7127/rbai.v12n200676
18. Guimarães, B. V. C.; Donato, S. L. R.; Aspiazú, I.; Azevedo, A. M.; Carvalho, A. J. de. 2019. Size of plots for experiments with cactus pear cv. Gigante. Revista Brasileira de Engenharia Agrícola e Ambiental. 23(5): 347-351. https://dx.doi.org/10.1590/1807-1929/agriambi. v23n5p347-351
19. Keller, K. R. 1949. Uniformity trial on Hops, Humulus lupulus L., for increasing the precision of field experiments. Agronomy Journal. 41(8): 389-392. https://doi.org/10.2134/agronj1949.0 0021962004100080011x
20 Lessman, K. J.; Atkins, R. E. 1963. Optimum plot size and relative efficiency of lattice designs for grain sorghum yield test. Crop Science. 3: 477-481. http://dx.doi.org/10.1590/S0103- 90162004000400017
21. Lobo, T. F.; Filho, H. G.; Büll, L. T.; Souza, F. L. P. 2015. Effect of nitrogen and sewage sludge on bean plant nutrition. Revista Verde de Agroecologia e Desenvolvimento Sustentável. 10(2): 33-41. https://www.researchgate.net/publication/259936572_Effect_of_sewage_sludge_and_nitrogen_in_the_nutrition_and_initial_development_of_castorbean#fullTextFileContent
22. Lovato, F.; Kowaleski, J.; Silva, S. Z.; Heldt, L. F. S. 2018. Proximate composition and mineral content of different cultivars of biofortified beans (Phaseolus vulgaris L.). Brazilian Journal of Food Technology. 21: e2017068. http://dx.doi.org/10.1590/1981-6723.6817
23. Medianeira Giroletta dos Santos, C.; dos Santos Silva, J. A.; Prevedel Capristo, D.; Matinho Correa, A.; Pereira Ribeiro, L. 2020. Genetic parameters and association between agronomic traits in special-grain common bean (Phaseolus vulgaris L.) genotypes. Revista de la Facultad de Ciencias Agrarias. Universidad Nacional de Cuyo. Mendoza. Argentina. 52(2): 1-11.
24. Meier, V. D.; Lessman, K. J. 1971. Estimation of optimum field plot shape and size for testing yield in Crambe abyssinica hordnt. Crop Science. 11: 648-650. https://doi.org/10.2135/ cropsci1971.0011183X001100050013x
25. Michels, R. N.; Canteri, M. G.; Fonseca, I. C. B.; Aguiar e Silva, M. A.; Bertozzi, J.; Dal Bosco, T. C. 2020. Estimating optimum plot size with radiometer for experiments on soybeans treated with fungicide. Summa Phytopathologica. 46(4): 308-312. https://doi.org/10.1590/0100- 5405/238411
26. Nogueira, C. O. G.; Oliveira, D. P.; Ferreira, P. A. A.; Pereira, J. P. A. R.; Vale, H. M. M.; Andrade, M. J. B.; Moreira, F. M. S. 2017. Agronomic efficiency of Rhizobium strains from the Amazon region in common bean. Acta Amazonica. 47(3): 273-276. http://dx.doi.org/10.1590/1809- 4392201603422
27. Pereira, A. S.; Silva, G. O.; Carvalho, A. D. F. 2017. Minimum plot size to evaluate potato tuber yield traits. Horticultura Brasileira. 35: 604-608. http://dx.doi.org/10.1590/s0102- 05362017042020
28. Santos, A. M. P. B.; Peixoto, C. P.; Almeida, A. T.; Santos, J. M. S.; Machado, G. S. 2015. Tamanho ótimo de parcela para a cultura de girassol em três arranjos espaciais de plantas. Revista Caatinga. 4(8): 265-273. http://dx.doi.org/10.1590/1983-21252015v28n430rc
29. Smiderle, E. C.; Botelho, F. B. S.; Guilherme, S. R.; Arantes, S. A. C. M.; Botelho, R. T. C.; Arantes, K. R. 2014. Tamanho de parcelas experimentais para a seleção de genótipos na cultura do feijoeiro. Comunicata Scientiae. 5(1): 51-58. https://dialnet.unirioja.es/servlet/articulo?codigo=5022034
30. Sousa, R. P. de; Silva, P. S. L.; Assis, J. P. de; Silva, P. I. B.; Silva, J. C. V. 2015. Optimum plot size for experiments with the sunflower. Tamanho ótimo da parcela para experimentação com girassol. Revista Ciência Agronômica. 1(46): 170-175. http://dx.doi.org/10.1590/S1806- 66902015000100020
31. Sousa, R. P.; Silva, P. S. L.; Assis, J. P. 2016. Tamanho e forma de parcelas para experimentos com girassol. Revista Ciência Agronômica, 4(47): 683-690. http://dx.doi.org/10.5935/1806- 6690.20160082
32. Viana, A. E. S.; Sediyama, T.; Cecon, P. R.; Lopes, S. C.; Sediyama, M. A. N. 2002. Estimativas de tamanho de parcelas em experimento com mandioca. Horticultura Brasileira. 1(20): 58-63. http://dx.doi.org/10.1590/S0102-05362002000100011