Revista de la Facultad de Ciencias Agrarias. Universidad Nacional de Cuyo. Tomo 54(1). ISSN (en línea) 1853-8665. Año 2022.
Original article
Influence of genotype-environment interaction on soybean (Glycine max L.) genetic divergence under semiarid conditions
Influencia de la interacción genotípica por ambientes en la divergencia genética de la soja (Glycine max L.) en condiciones semiáridas
José Ricardo Tavares de Albuquerque 1
Manoel Galdino dos Santos 1
Márcio Alexandre Moreira de Freitas 2
Fernando Sarmento de Oliveira 1
Almir Rogério Evangelista de Souza 3
Lindomar Maria da Silveira 1
Glauber Henrique de Sousa Nunes 1
Aurélio Paes Barros Júnior 1
Paulo Fernando de Melo Jorge Vieira 4
1 Universidade Federal Rural do Semi-Árido. Department of Agronomic and Forest Sciences. Mossoró. RN, Brazil.
2 Universidade Federal de Viçosa. Department of Agricultural Engineering. Viçosa. MG. Brazil.
3 Instituto Federal de Alagoas. Department of Agronomic Engineering. Piranhas. AL. Brazil.
4 Empresa Brasileira de Pesquisa Agropecuária. Embrapa Meio-Norte. Teresina. PI. Brazil.
Abstract
The objective of the present work was to evaluate the influence of the genotype-environment interaction on genetically divergent soybean grown under semiarid conditions. Four experiments were carried out in randomized blocks with four replicates to evaluate twenty-one soybean genotypes. The following descriptors were used to quantify divergence: plant height, dry matter, oil content, number of pods per plant, number of grains per pod, the weight of 100 seeds, yield, days for flowering, and days for maturation. The unweighted pair group method with arithmetic mean was used to group the genotypes from the Mahalanobis distance matrix estimated using the genotypic means estimated by the REML/BLUP method. The grouping of genotypes depended mainly on the effects of the interaction between genotypes and years. The joint analysis, without the effect of the interaction, allowed us to obtain two groups of genotypes. The most recommended crosses were those of the lines BRS Tracajá, BRS Pérola, BRS Carnaúba, M 8644 IPRO, BRS 8590, and BMX OPUS IPRO with the genotype BRS Sambaíba, especially the one between BMX OPUS IPRO and BRS Sambaíba.
Keywords: Glycine max L.; Germplasm; Dissimilarity; Choice of parents.
Resumen
El objetivo del presente trabajo fue evaluar la influencia de la interacción genotipo por ambiente en estudios de divergencia genética en soja en condiciones semiáridas. Se realizaron cuatro experimentos con un diseño de bloques completos aleatorizados con cuatro repeticiones donde se evaluaron 21 genotipos de soja. Se utilizaron los siguientes descriptores para cuantificar la divergencia: altura de planta, materia seca, contenido de aceite, número de vainas por planta, número de granos por vaina, peso de cien semillas, rendimiento, días a floración y días a maduración. Se utilizó el método jerárquico UPGMA para agrupar los genotipos de la matriz de distancias de Mahalanobis mediante las medias genotípicas estimadas por el método REML / BLUP. La agrupación de genotipos depende de las condiciones de evaluación, principalmente debido a los efectos de la interacción genotipo por años. El análisis conjunto, sin la presencia del efecto de interacción, permite obtener dos grupos de genotipos. Los cruzamientos más adecuados involucran los genotipos BRS Tracajá, BRS Pérola, BRS Carnaúba, M 8644 IPRO, BRS 8590 y BMX OPUS IPRO, y el genotipo BRS Sambaíba, especialmente el entre BMX OPUS IPRO y el genotipo BRS Sambaíba, que es el de mayor disimilitud.
Palabras claves: Glycine max L.; Germoplasma; Disimilitud; Elección de padres.
Originales: Recepción: 08/12/2020
Aceptación: 23/03/2022
Introduction
Soybean (Glycine max L. Merrill) is a legume of great importance in the world economy because of its extensive cultivation and world trade. It is widely used as a raw material in animal feed, food, vegetable oils, biofuel, and the chemical industry. Brazil is the largest exporter and the second-largest producer of oilseeds. In the 2019/2020 harvest, the country had an average productivity of 3.321 kg ha-1, resulting from a production of 118.8 million tons of grain in 35,760.4 thousand hectares of land. During this harvest, the cultivated area increased by 1.7% relative to the past harvest (2, 10), due to the expansion of the agricultural frontier with the exploration of the Brazilian semiarid region. Considering the need for irrigation, as well as the high temperatures that prevail in the semi-arid region, this expansion may constitute an opportunity for the diversification of crops in the region, particularly for seed production since irrigated crops require greater investment. Therefore, it is necessary to work with cultivars adapted to the new growing conditions, which requires the evaluation of the behavior of soybean genotypes under the non-edaphoclimatic and specific desired agricultural conditions. It is crucial to consider the possibility of not finding an adapted genotype with the desired characteristics among those available. In this case, it is necessary to work with breeders to develop adapted cultivars with characteristics suitable for the market.
The cultivar experiments, sometimes called value of cultivation and use (VCU) tests, are generally carried out in different environments, either local or through years of cultivation, characteristic of the region of interest. When several genotypes are evaluated in more than one environment, the presence of a genotype-environment interaction is common (G × E). This phenomenon is defined as the differential behavior of genotypes across environments and assumes an important role in phenotypic manifestation. The G × E interaction, when predominantly qualitative or crossed, hinders the selection process or recommendation of cultivars, since the order of genotypes is altered in the assessment environments.
Information on genotypic performance may also be relevant when choosing the parent strains for breeding programs. In this context, although productivity is the characteristic of greatest interest, other characteristics are relevant for soybeans and are therefore considered in the genotypic evaluation. When information on various traits-whether morphological, agronomic, biochemical, or molecular-is available, it becomes possible to carry out genetic divergence studies. However, even though the presence of genotype-environment interaction in soybeans and other crops is notorious, there is little information about its influence on divergence studies since genetic divergence studies are generally performed in only one evaluation environment.
Filling this knowledge gap requires intensive efforts of researchers, more specifically the curators of germplasm banks and breeders since divergence studies are important with respect to two main aspects. The first aspect is related to the intrinsic activities carried out in germplasm banks to evaluate the entire variation structure to preserve it and optimize its maintenance in nuclear collections. A second aspect, no less important in relation to the first, is that studies of genetic divergence are used to define groups with the intention of directing crossings that could potentially generate segregated populations with greater genetic variability (25, 34). Indeed, considering that the interaction between genotypes and environments can alter the characterization of genotypes in groups according to environmental conditions, it may be challenging to define the crossings.
The aforementioned considerations and the lack of studies of this nature motivated the realization of the present work, which proposes to study the effect of the genotype- environment interaction on the genetic divergence of soybean genotypes evaluated under semiarid conditions.
Material and methods
Environmental characterization
This study was carried out during the dry seasons of 2016-2017, and rainy seasons of 2017-2018 in the municipality of Mossoró, Rio Grande do Norte, Brazil (5° 03' 37″ " S, 37° 23' 50"″ W, 72 m altitude). According to the Koppen climate classification (1), the climate of the site is DdAa, semi-arid, and megathermal, with little or no excess precipitation during the year; in addition, it is BShw - dry and very hot.
The average meteorological data for the experimental period are shown in Figure 1.
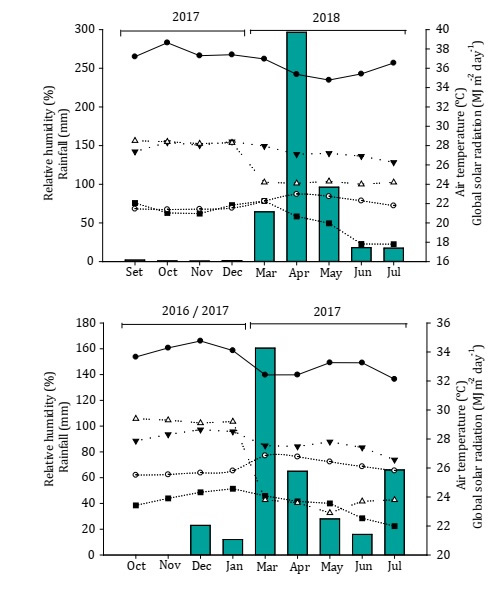
Figure 1: Mean values of maximum, minimum and average air temperature (°C), relative humidity (%), solar radiation (MJ m-2 day-1) and rainfall (mm) for four soybean crops in the years 2016/2017, 2017.1, 2017.2 and 2018.1.
Figura 1: Valores promedio de temperatura máxima, media y mínima del aire (°C), humedad relativa (%), radiación solar (MJ m-2 día-1) y precipitación (mm) para cuatro cultivos de soja en las campañas 2016/2017, 2017.1, 2017.2 y 2018.1.
The experiments were started on the following planting dates: September 25, 2016, March 29, 2017, September 30, 2017, and March 16, 2018.
The soil of the experimental field was classified as typical red dystrophic argisol (14), whose chemical analysis results, at a depth of 0.20 m, before starting each experiment are shown in Table 1.
Table 1: Chemical analysis of the soil, in each year of cultivation, referring to the depth of 0.20 m.
Tabla 1: Análisis químicos del suelo, para cada campaña, referidos a la profundidad de 0,20 m.
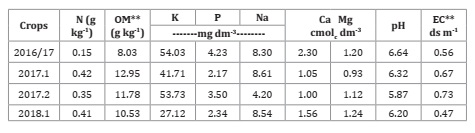
**EC = electrical conductivity; OM = organic matter.
**CE = Conductividad eléctrica; MO = materia orgánica.
Germplasm
The identification and characteristics of the soybean genotypes evaluated and belonging to Embrapa Meio-Norte are shown in Table 2.
Table 2: Category, identification, name, maturation group and cycle of 21 soybean genotypes evaluated in four harvests under semiarid conditions.
Tabla 2: Categoría, identificación, nombre, grupo de madurez y ciclo de 21 genotipos de soja evaluados en cuatro cosechas en condiciones semiáridas.
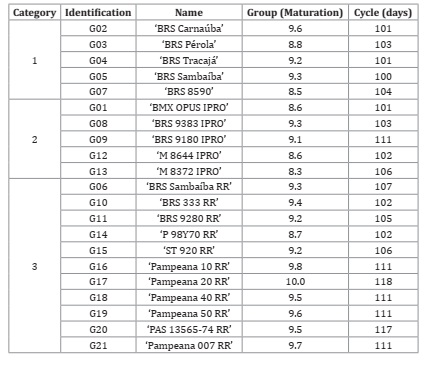
Category 1: conventional soybean genotypes. Category 2: high-yield soybean genotypes, resistant to glyphosate and which have protection and suppression against some soy pests. Category 3: glyphosate resistant soybean genotypes.
Categoría 1: genotipos convencionales de soja. Categoría 2: genotipos de soja de alto rendimiento, resistentes al glifosato y que tienen protección y supresión contra algunas plagas de la soja. Categoría 3: genotipos de soja resistentes al glifosato.
Experimental details
The seeds were inoculated before sowing with 4 g of peat inoculant per kg of seeds (TotalNitro Ultra) and 500 ml ha-1 of liquid (TotalNitro Full) was applied to the seeds in the planting furrow, ensuring that the seeds were completely covered by the inoculant. The inoculants were obtained from Total Biotecnologia, Curitiba, Paraná, Brazil. According to the desired spacing, sowing was performed manually with the help of previously drilled wooden rulers.
Weed control was performed manually with hoes after sowing, as recommended (Dugje et al. 2009). Due to the unstable precipitation during the experimental period, water complementation was carried out when necessary. Irrigation was carried out by spraying, with a daily watering shift divided into two applications (morning and afternoon), according to the water requirement of the culture and based on the reference evapotranspiration (ETo) rate. During the rainy season, irrigation was performed only when necessary.
Fertilization was carried out as recommended for the crop and based on the results of the soil analysis, with 60 kg ha-1 of P2O5 being applied during planting and 60 kg ha-1 of K2O in coverage (16). The sources of Phosphorus and Potassium were simple superphosphate and potassium chloride, respectively.
Evaluated keywords
The evaluated characteristics were: a) plant height: measured using a ruler, across ten random plants in the plot in phase R5.3, according to the methods described in the study of (9, 35); b) dry matter: evaluated using samples from ten plants per plot; the samples were placed in an oven with forced air circulation at 65 °C, until they reached a constant weight, according to the method of Brandt et al. (2006); c) oil content: determined with 30 g (ground) of seeds from each plot using the Near Infrared Reflection (NIR) technique and expressed as a percentage (%), according to the method of Heil (2010); d) number of pods per plant: obtained by counting the number of pods per plant; e) number of grains per pod: obtained by counting the number of grains in the pods divided by the total number of pods; f) weight of one hundred seeds: determined according to the mass and total number of seeds per experimental unit; g) productivity: upon reaching physiological maturity (95% of the mature pods), the soybean plants were harvested from the two central rows of each plot, 4 m2, with a 0.5 m edge left unharvested. After harvesting, the plants were trailed, and the seeds were then weighed, after drying (12% humidity) and cleaning, to determine the grain yield of kg ha-1; (h) days for flowering: the days from emergence necessary to have an open flower in 50% of the plants of the plot; this characteristic was evaluated using ten plants chosen at random, according to the method employed by Carvalho (2014); and i) days for maturation: determined from the number of days from emergence necessary to have 95% of mature pods; this characteristic was evaluated using ten random plants in the plot, according to that method.
Statistical analysis
The REML/BLUP
analysis was performed using Model 54 of the SELEGEN software (30). Through this
model, the empirical BLUP predictors of genotypic values free from interaction
were obtained, and were given by ![]() , where
, where ![]() is the average
of all environments, and
is the average
of all environments, and ![]() is the free genotype effect of the genotype × environment
interaction. For each environment “j,” genotype values are predicted by
is the free genotype effect of the genotype × environment
interaction. For each environment “j,” genotype values are predicted by ![]() , where
, where ![]() is the
environment average “j,”
is the
environment average “j,”
![]() is the genotypic effect, and
is the genotypic effect, and ![]() is the effect of the
genotype × environment interaction concerning the genotype “i”. The generalized
Mahalanobis distances were calculated from the matrix of the genotypic averages
of each characteristic for each genotype and from the residual
variance-covariance matrix (20). Cluster
analysis was performed with the Mahalanobis distance matrix between genotypes,
using the unweighted pair group method with arithmetic mean (UPGMA). The
quality of the adjustment was quantified using the cophenetic correlation
coefficient (32). The analyses
were processed using the Genes program (2016), and the
Pheatmap (18) and Biotools
(31) packages of
Project R (27).
is the effect of the
genotype × environment interaction concerning the genotype “i”. The generalized
Mahalanobis distances were calculated from the matrix of the genotypic averages
of each characteristic for each genotype and from the residual
variance-covariance matrix (20). Cluster
analysis was performed with the Mahalanobis distance matrix between genotypes,
using the unweighted pair group method with arithmetic mean (UPGMA). The
quality of the adjustment was quantified using the cophenetic correlation
coefficient (32). The analyses
were processed using the Genes program (2016), and the
Pheatmap (18) and Biotools
(31) packages of
Project R (27).
Results and discussion
The results of our experiments showed that the data obtained for the various characteristics were within the range observed for soybeans, with the lowest value observed for oil content (4.28%), and the highest for dry matter (51.18%). With the exception of dry matter, the estimated values of the evaluated characteristics were within the CV range observed for soybean (7, 11, 19, 21, 26). The highest selective accuracy was verified for flowering and maturation and the lowest for dry matter, conforming to the lowest precision observed for the latter characteristic. The accuracy of the results of the present study is considered low for dry matter (<0.30), moderate for the number of pods per plant (0.50 to 0.69), very high for flowering and maturation (>90), and high for the other characteristics (0.70 to 0.89), according to Resende and Duarte, 2007 (Table 3).
Table 3: Deviance analysis, estimates of variance components and genetic and phenotypic parameters for nine characters measured in soybean genotypes evaluated in four trials conducted under semiarid conditions.
Tabla 3: Análisis de varianza, estimaciones de componentes de varianza, parámetros genéticos y fenotípicos para nueve caracteres medidos en genotipos de soja evaluados en cuatro ensayos realizados en condiciones semiáridas.
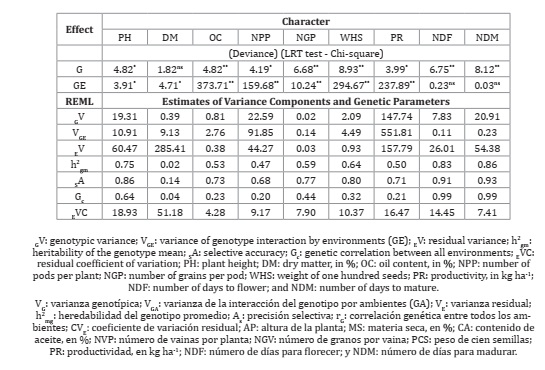
A significant effect of genotypes was observed for all characteristics evaluated, except for dry matter, indicating genetic heterogeneity between the genotypes, a fact that corroborates the estimates of average heritability. Although not very high, this variability can be corroborated by heritability estimates, except dry matter. Heritability in the broad sense quantifies the fraction of phenotypic variance resulting from genotypic causes. Heritability ranges from 0 to 1.0, with estimates close to the unit indicating lesser environmental effect on the characteristic. Quantitative characteristics have a greater environmental effect and tend to have lower heritability values (4). This occurred with dry matter, but for most of the other characteristics, heritability can be considered intermediate. For plant height, flowering, and maturation, heritability was high, indicating less environmental effects on these characteristics.
The genotype-environment (G × E) interaction was significant for all characteristics, with the exception of the number of days for flowering and maturation (Table 3). The presence of the G × E interaction is a common phenomenon in the evaluation tests of soybean cultivars and reflects the differential behavior of the genotypes in different environments (28). The variance component of the G × E interaction was superior to that of the genotypic variance for the characteristics of dry matter, oil content, number of pods per plant, number of grains per pod, weight of 100 seeds, and productivity (Table 3), indicating a greater influence of the interaction on phenotypic variation. This is not commonly observed duirng the evaluation of soybean genotypes in various environments. Generally, for soybeans, the effect of genotypes has a greater effect on the phenotype (3, 5, 22, 26, 33).
The interaction can be quantitative because of the magnitude of the differences between the genotypes in the environments or qualitative due to the lack of genotypic correlation in the environment (15, 24). In this work, considering the values of genotypic correlation in all environments, ranged from 0.02 (dry matter) to 0.64 (plant height), the interaction was predominantly qualitative for all characteristics for which the G x E interaction existed (Table 3). The predominance of cross-interaction hinders the work of breeders because the characteristics of the genotypes are significantly altered in different environments. In this situation, it is difficult to recommend a genotype suitable for all environments, and specific recommendations are necessary. On the other hand, it is important to emphasize that the northeast region of Brazil has proven to be highly suitable for irrigated cultivation, including that of fruits, vegetables, and grains. On the other hand, because it does not have well-defined climatic seasons, being most often defined only in terms of the rainy season and the dry season, it can lead researchers and producers to make errors when recommending genotypes for cultivation in semi-arid conditions. Thus, studies such as the one presented in this work become quite relevant since the agricultural frontier for soybean cultivation has increased in the northeast region of Brazil, as has the demand for adapted cultivars. The presence of cross-interaction has also been mentioned by several authors when evaluating soybean cultivars under different edaphoclimatic conditions (8, 11, 23, 26, 33).
The hierarchical clustering analysis (UPGMA) showed different results throughout the evaluations, although there was little discrimination between the genotypes (Figure 2).
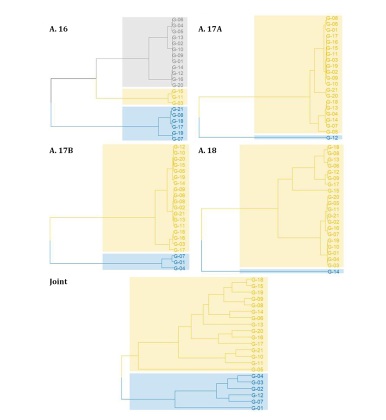
Figure 2: UPGMA dendrograms obtained from the Mahalanobis distance matrix between soybean genotypes evaluated in four tests conducted under semiarid conditions.
Figura 2: Dendrogramas de UPGMA obtenidos de la matriz de distancias de Mahalanobis entre genotipos de soja evaluados en cuatro pruebas realizadas en condiciones semiáridas.
It is noteworthy that the estimates of cophenetic correlation were higher than 0.85 in all evaluations, indicating a high quality of grouping; that is, there is a lot of similarity between the original and final dissimilarity matrices (28, dutra).
In 2016, three groups of genotypes were determined. The first consisted of G-21, G-08, G-18, G-17, G-19, and G-07. The second group was formed only by genotypes G-15, G-11, and G-03. The third group consisted of all other genotypes. In the 2017 A evaluation, all genotypes were classified in practically the same group, with the G-12 genotype not being grouped (Figure 2). In the evaluation of 2018, the genotype not grouped with the other genotypes was G-14. In the 2017 B evaluation, genotypes G-07, G-01, and G-04 were classified together in a group, while the other genotypes formed the second group. The joint analysis subdivided the genotypes into a smaller group composed of G-04, G-03, G-02, G-12, G-07 and G-01. The second group included all other genotypes.
To evaluate the contribution of the characteristics to diversity, the technique of main components was used. In all evaluations, the first four main components explained more than 70% of the total variation observed, revealing a reduction in the multidimensional space from nova to just four main orthogonal components (Table 4).
Table 4: Character contribution to the eigenvalue λi in the analysis of major components involving soybean genotypes evaluated in four tests conducted under semiarid conditions.
Tabla 4: Contribución del carácter al valor propio λi en el análisis de componentes principales que involucran genotipos de soja evaluados en cuatro ensayos realizados en condiciones semiáridas.
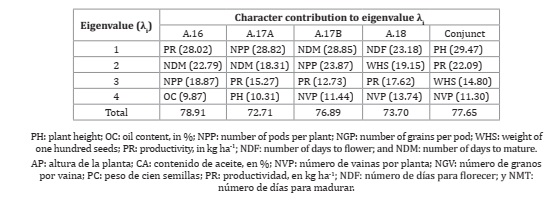
Using the weights in the first four components, the characteristics with the greatest participation in the divergence considering all four evaluations were productivity, number of pods per plant, and the number of days for maturation. In the joint analysis, the most prominent characteristics were plant height and productivity. Also worth mentioning is the characteristic of the number of grains per pod in the two evaluations and in the joint analysis. Considering that for the aforementioned characteristics, there was a predominance of cross-interaction (Table 3), it appears that the G × E interaction has a relevant weight in the ordering of distances and, consequently, changes in the groups formed.
Another result that reinforces the fact that the order of the distances was altered in the different evaluations is that of the estimates of the correlations between the dissimilarity matrices. The correlations were practically non-significant, except for the correlation between the joint analysis and the 2017 B assessment (Figure 3).
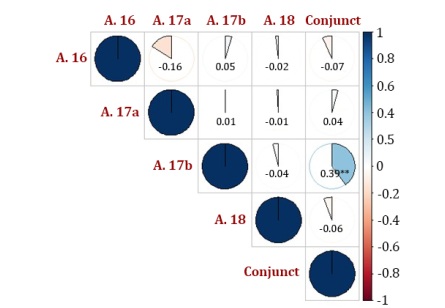
Figure 3: Correlations between Mahalanobis distance matrices of soybean genotypes evaluated in four trials conducted under semiarid conditions.
Figura 3: Correlaciones entre matrices de distancia de Mahalanobis de genotipos de soja evaluadas en cuatro ensayos realizados en condiciones semiáridas.
Although there is vast literature that addresses the effects of the G × E interaction on the selection and identification of cultivars, resulting from the differential behavior of genotypes in the environment, little attention has been paid to the effect of the interaction in diversity studies. Considering that divergence studies are used for determining the initial direction of crossings in order to obtain populations with great variability and a high mean for the characteristics of interest, it is relevant to investigate the effect of the interaction in the formation of heterotic groups, as in the nuclear collections. In the present study, there were differences in the grouping during the four evaluations.
The presence of the genotype-environment interaction effect confused with the genotypic effect in each of the four evaluations, not only resulted in differences in the groups, but also made it difficult to differentiate the evaluated genotypes. The use of the estimates of the free genotypic means of the interaction obtained in the joint analysis may be a more adequate alternative to define the heterotic groups and, consequently, the crossings to be performed. In the present study, crosses were made between the genotypes of the group consisting of G-04, G-03, G-02, G-12, G-07, and G-01 and the genotypes of the second group, in particular, the G-05 genotype. The greatest dissimilarity was found between genotypes G-01 and G-05, shown in red on the heat map (Figure 4).
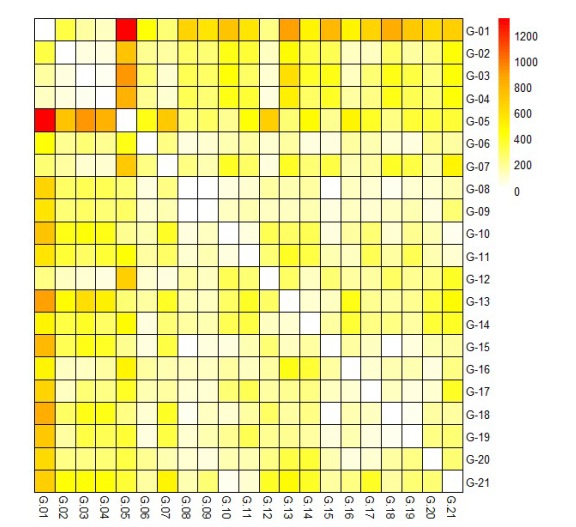
Figure 4: Mahalanobis distances of evaluated soybean genotypes obtained in the joint analysis of four tests conducted under semiarid conditions.
Figura 4: Distancias de Mahalanobis de genotipos de soja evaluados obtenidos en el análisis conjunto de cuatro pruebas realizadas en condiciones semiáridas.
Crosses can be made between the G-01 genotype and the G-13, G-15, and G-18 genotypes.
Conclusions
The grouping of soybean accessions is dependent on the evaluation conditions, mainly because of the effects of the genotype por environment interaction. Without the effect of the interaction, the joint analysis allowed us to obtain two groups of genotypes. The most suitable crosses were those carried out between the genotypes BRS Tracajá, BRS Pérola, BRS Carnaúba, M 8644 IPRO, BRS 8590, and BMX OPUS IPRO, and the BRS Sambaíba genotype, especially the one between BMX OPUS IPRO and BRS Sambaíba genotype, which is the most dissimilar.
Acknowledgements
To “Aperfeiçoamento de Pessoal de Nível Superior - Brazil (CAPES) - Finance Code 001” for financial support.
1. Alvares, C. A.; Stape, J. L.; Sentelhas, P.C.; Moraes, J. L. G; Sparovek, G. 2013. Köppen's climate classification map for Brazil. Meteorologische Zeitschrift. 22: 711-728. DOI: 10.1127/0941- 2948/2013/0507.
2. Alves da Silva, C.; Azevedo Santos, E.; Pio Viana, A.; Machado Dias, J. R.; Partelli, F. L. 2021. Genetic diversity in Coffea canephora genotypes for leaf nutrient concentration. Revista de la Facultad de Ciencias Agrarias. Universidad Nacional de Cuyo. 53(1): 22-34. https://doi. org/10.48162/rev.39.003
3. Alves, R.; Rocha, J.; Teodoro, L.; Carvalho, L.; Farias, F.; Resende, M.; Bhering, L.; Teodoro, P. 2021. Path analysis under multiple-trait BLUP: application in the study of interrelationships among traits related to cotton fiber length. Revista de la Facultad de Ciencias Agrarias. Universidad Nacional de Cuyo. 53(1): 1-10. https://doi.org/10.48162/rev.39.001
4. Bastiaanse, H.; Zinkgraf, M.; Canning, C.; Tsai, H.; Lieberman, M.; Comai, L.; Henry, I.; Groover, A. 2019. A comprehensive genomic scan reveals gene dosage balance impacts on quantitative traits in Populus trees. Proceedings of National Academy Science of United States America. 16: 13690-13699. DOI: 10.1073/pnas.1903229116.
5. Bornhofen, E.; Benin, G.; Storck, L.; Woyann, L. G.; Duarte, T.; Stoco, M. G.; Marchioro, S. V. 2017. Statistical methods to study adaptability and stability of wheat genotypes. Bragantia. 76: 1-10. DOI: 10.1590/1678-4499.557.
6. Brandt, E. A.; Souza, L. C. F.; Vitorino, A. C. D.; Marchetti, M. E. 2006. Desempenho agronômico de soja em função da sucessão de culturas em sistema plantio direto. Ciência e Agrotecnologia. 30: 869-874. DOI: 10.1590/S1413-70542006000500007.
7. Bulegon, L. G.; Rampim, L.; Klein, J.; Kestring, D.; Guimarães, V. F.; Battistus, A. G.; Inagaki, A. M. 2016. Componentes de produção e produtividade da cultura da soja submetida à inoculação de Bradyrhizobium e Azospirillum. Terra Latino-Americana. 34: 169-176.
8. Câmara, A. R.; Moraes, R. N. O.; Simon, G. A. 2018. Adaptabilidade e estabilidade de genótipos de soja nos estados de Goiás e Minas Gerais. Global Science Technology. 11: 23-36.
9. Carvalho, M. M. 2014. Influência de sistemas de semeadura na população de pragas e nas características morfofisiológicas em cultivares de soja. Dissertação - Mestrado em Agronomia (Proteção de Plantas) - Universidade Estadual Paulista “Júlio de Mesquita Filho” Faculdade De Ciências Agronômicas Campus De Botucatu.
10. CONAB - Companhia Nacional de Abastecimento. 2020. Acompanhamento da safra brasileira de grãos, v. 7 - Safra 2019/20 - Sétimo levantamento, Brasília, p. 1-66. http://www.conab.gov.br/info-agro/safras/graos. Accessed on: April 20, 2020.
11. Cruz, C. D. 2016. Genes Software - extended and integrated with the R, Matlab and Selegen. Acta Scientiarum. Agronomy. 38: 547-552. DOI: 10.4025/actasciagron.v38i4.32629.
12. Dugje, I. Y.; Omoigui, L. O.; Ekeleme, F.; Bandyopadhyay, R.; Lava Kumar, P.; Kamara, A. Y. 2009. Farmers’ guide to soybean production in Northern Nigeria. International Institute of Tropical Agriculture. 21 p.
13. Dutra Filho, J. de A.; Souto, L. S.; de Luna, R. G.; Souza, A. dos S.; Silva, F. G.; Silva, F. A. C.; Simões Neto, D. E.; Calsa Júnior, T. 2021. Mixed modeling for fiber yield genetic selection in sugarcane. Revista de la Facultad de Ciencias Agrarias. Universidad Nacional de Cuyo. 53(2): 11-19. https://doi.org/10.48162/rev.39.034
14. Embrapa Solos. 2013. Sistema brasileiro de classificação de solos. Centro Nacional de Pesquisa de Solos: Rio de Janeiro. p. 353.
15. Gilli, J. R.; Vellicce, G. R.; Bernardi, C. N. 2020. SSR markers linked to stem canker resistance in soybean (Glycine max). Revista de la Facultad de Ciencias Agrarias . Universidad Nacional de Cuyo. 52(1): 26-39.
16. Gomes, R. V.; Coutinho, J. L. B. 2008. Recomendações de adubação para o Estado de Pernambuco: 2° aproximação. 3° ed. Revisada. Recife: Instituto Agronômico de Pernambuco-IPA. 212 p.
17. Heil, C. 2010. Rapid, multi-component analysis of soybeans by FT-NIR Spectroscopy. Madison: Thermo Fisher Scientific. 3 p. http://www.nicoletcz.cz/userfiles/file/vjecy/soybeans.pdf. Accessed on: December 28, 2019.
18. Kolde, R. 2019. Pheatmap: Pretty Heatmaps. R package version 1.0.12. https://CRAN.R-project.org/package=pheatmap.
19. Lemos, L. B.; Farinelli, R.; Cavariani, C.; Zapparoli, R.A. 2011. Desempenho agronômico e produtivo de cultivares de soja em diferentes safras. Científica. 39: 44-51.
20. Mahalanobis, P. C. 1936. On the generalized distance in statistics. Proceedings of Natural Institute of Sciences. 2: 49-55.
21. Meier, C.; Meira, D.; Marchioro, V. S.; Olivoto, T.; Klein, L. A.; Moro, E. D.; Lunkes, A.; Rigatti, A.; Bello, R. F.; Bueno, R. B.; Souza, V. Q. 2019. Performance agronômica e correlação linear entre componentes de rendimento da soja em segunda safra. Revista de Ciências Agrárias. 42: 933-941. DOI: 10.19084/rca.17995.
22. Milioli, A. S.; Zdziarski, A. D.; Woyann, L. G.; Santos, R.; Rosa, A. C.; Madureira, A.; Benin, G. 2018. Yield stability and relationships among stability parameters in soybean genotypes across years. Chilean Journal of Agricultural Research. 78: 299-309. DOI: 10.4067/S0718- 58392018000200299.
23. Oda, M. C.; Sediyama, T.; Matsuo, E.; Nascimento, M.; Cruz, C. D. 2019. Estabilidade e adaptabilidade de produção de grãos de soja por meio de metodologias tradicionais e redes neurais artificiais. Scientia Agraria Paranaensis. 18: 117-124.
24. Olivoto, T.; Lúcio, A. D. C.; Silva, J. A. G.; Sari, B. G.; Diel, M. I. 2019. Mean performance and stability in multi-environment trials II: selection based on multiple traits. Agronomy Journal. 111: 2961-2969. DOI: 10.2134/agronj2019.03.0221.
25. Ribeiro, R. M. P.; Alves Pereira, C. C.; da Silveira, L. M.; de Sousa Nunes, G. H.; Rabelo Ramalho Ramos, S.; de Queiroz, M. A.; de Freitas Souza, M.; Anizio Lins, H.; Barros Júnior, A. P. 2020. Indirect selection for content of carotenoid in pumpkin accessions. Revista de la Facultad de Ciencias Agrarias . Universidad Nacional de Cuyo. 52(2): 12-21.
26. Pereira, W. A.; Silva, A. S. L.; Nobre, D. A. C.; Paula, G. S.; Silva, F. L. 2018. Performance of transgenic and conventional soybean plants subjected to bioassay for detection of glyphosate tolerant seeds. Crop Breeding and Applied Biotechnology. 18: 39-46. DOI: 10.1590/1984-70332018v18n1a6.
27. R Core Team. 2020. R: A language and environment for statistical computing. R Foundation for Statistical Computing, Vienna, Austria. http://www.r-project.org. Accessed on: January 20, 2020.
28. Ramalho, M. A. P.; Abreu, A. F. B.; Santos, J. B.; Nunes, J. A. R. 2012. Aplicações da genética quantitativa no melhoramento de plantas autógamas. Lavras: UFLA. 522p.
29. Resende, M. D. V.; Duarte, J. B. 2007. Precisão e controle de qualidade em experimentos de avaliação de cultivares. Pesquisa Agropecuária Tropical. 37: 182-194.
30. Resende, M. D. V. 2016. Software Selegen-REML/BLUP: a useful tool for plant breeding. Crop Breeding and Applied Biotechnology. 16: 330-339. DOI: 10.1590/1984-70332016v16n4a49.
31. Silva, A. R.; Malafaia, G.; Menezes, I. P. P. 2017. Biotools: an R function to predict spatial gene diversity via an individual-based approach. Genetics and Molecular Research. 16: 2-6. DOI: 10.4238/gmr16029655.
32. Sokal, R. R.; Rohlf, F. J. 1962. The comparison of dendrograms by objective methods. Taxonomy. 11: 30-40.
33. Tolorunse, K. D.; Gana, A. S.; Bala, A.; Sangodele, E. A. 2018. Yield stability studies of soybean (Glycine max (L.) Merrill) under rhizobia inoculation in the savanna region of Nigeria. Plant Breeding. 137: 262-270. DOI: 10.1111/pbr.12583.
34. Torres, F. E.; David, G. V.; Teodoro, P. E.; Ribeiro, L. P.; Correa, C. G.; Luz Júnior, R. A. 2015. Desempenho agronómico e dissimilaridade genética entre genótipos de soja. Revista de Ciências Agrárias. 38: 111-117.
35. Zambiazzi, E. V. 2014. Aplicações da adubação potássica na cultura da soja. Dissertação (Mestrado em Agronomia/Fitotecnia) - Universidade Federal de Lavras.