Revista de la Facultad de Ciencias
Agrarias. Universidad Nacional de Cuyo. Tomo 54(2). ISSN (en línea) 1853-8665.
Año 2022.
Original article
Comparison of visual
risk assessment methods applied in street trees of Montevideo city, Uruguay
Comparación de métodos de evaluación visual del riesgo
aplicados en árboles de veredas de la ciudad de Montevideo, Uruguay
Cecilia Ameneiros 1
Paulina Fratti 1
Agustina Sergio 1
Mauricio Ponce-Donoso 2
Óscar Vallejos-Barra 2
1 Universidad de la República. Facultad de Agronomía.
Departamento Forestal. Av. Garzón 78012900. Montevideo. Uruguay.
2
Universidad de Talca. Av.
Lircay s/n. 3460000. Talca. Chile.
*paula.coelho@fagro.edu.uy
Abstract
Risk assessment
of urban trees is an incipient practice in Latin America, generally performed
with foreign methods, due to the lack of qualified personnel and locally
validated or adapted methodology. This article evaluates the application of
three methods on street trees in Montevideo city, Uruguay: Tree Hazard Risk
Evaluation and Treatment System (THREATS), Quantified Tree Risk Assessment
(QTRA) and Best Management Practices - Tree Risk Assessment (ISA BMP). Three
assessors with similar experience applied three methods in 36 trees of three
widely used genera, totaling 324 assessments and 1,296 data. The methods were
decomposed into the components: Likelihood of Failure, Likelihood of Impact,
Consequence and Risk Rating. The data were statistically analyzed through a
generalized linear mixed model (p<0.05), for the factors: assessor, method,
genus, and their interactions. Results showed no significant differences among
assessors, but there were differences among methods, specifically for the
Likelihood of Impact and Risk Rating components. The ISA BMP method presented
higher means in these last two components. Still, this method is suggested for
street trees in Montevideo until a more appropriate method is adapted or
developed for local conditions.
Keywords: Arboriculture; Hazard tree; Risk component; Tree risk; Urban forest.
Resumen
La evaluación del riesgo de árboles urbanos es una práctica incipiente en
América Latina, debido a la falta de personal calificado y métodos locales
validados o adaptados, debiendo utilizarse métodos foráneos. Este artículo
evalúa la aplicación de tres de estos métodos en árboles de veredas de la
ciudad de Montevideo, Uruguay: Tree Hazard Risk Evaluation and Treatment System
(THREATS), Quantified Tree Risk Assessment (QTRA) and Best Management Practices
- Tree Risk Assessment (ISA BMP). Estos fueron aplicados por tres evaluadores
con similar nivel de experiencia, en 36 árboles de tres géneros ampliamente
utilizados, totalizando 324 evaluaciones y 1.296 datos. Los métodos fueron descompuestos
en los componentes: Probabilidad de Falla, Probabilidad de Impacto,
Consecuencia y Clasificación del Riesgo. Los datos fueron analizados
estadísticamente a través de un modelo lineal generalizado mixto (p<0,05),
considerando los factores: evaluador, método, género, y sus interacciones. Los
resultados no muestran diferencias significativas entre evaluadores, pero sí
entre métodos, específicamente para Probabilidad de Impacto y Clasificación del
Riesgo. El método ISA BMP presentó mayores promedios en estos dos últimos
componentes, aun así, se sugiere su uso para árboles ubicados en calles de
Montevideo mientras no se desarrolle o adapte un método a las condiciones
locales.
Palabras
clave: Arboricultura; Árbol peligroso; Componentes del riesgo; Riesgo del árbol; Bosque urbano.
Originales:
Recepción: 10/07/2020
Aceptación: 12/04/2022
Introduction
Urban trees
(UT) take part in the physiognomic and structural configuration of cities (2), as fundamental elements of well-being in
urban landscape and environment (10, 24). Given the importance of UT, keeping them in
the best possible conditions turns relevant. This implies incorporating risk
management (32), favoring
people, goods, and activities at the same time.
Tree
development in a constantly changing environment presents new challenges,
especially related to management. As climate change progresses, trees live less
than expected (29) causing damage
to infrastructure, requiring extra maintenance, and exposing the community to
higher risks, resulting in additional management costs (2). In this sense, good UT management should
minimize costs and maximize benefits (21).
Although
eliminating risks turns impossible, controlling tree damages (2, 6) allows reaching an acceptable risk level for
stakeholders (22). Trees
exceeding this level are considered dangerous (2).
Initiatives
developing visual assessment methods for UT risk date from 1990 (6, 7,
9, 20, 23). These methods can be
classified into qualitative, quantitative, or semiquantitative methods,
depending on the structure used for categorization of each risk component (13). For a method to be incorporated as a
management tool it must be complete, credible, feasible (substantiated),
reliable, repeatable, robust, simple, and valid (22). In general, different methods are organized
according to the components “likelihood of failure” and “likelihood of impact”,
with possible “consequences” of the eventual failure for people or property (31), as well as a corresponding “risk rating”.
This decomposition in components is a useful way to analyze method
applicability (3, 17).
UT likelihood
of failure is related to tree defects, with the most likely-to-fail trait being
the most relevant when assessing a potential failure directly related to the
potential consequences (3). The likelihood of impact is associated with
the area that the failed part or entire tree can impact -the target zone-,
related to the occupancy rate of people, goods and services potentially
impacted (20). Therefore,
high-use public spaces require the best attention (7, 15). Tree health and condition (7), as well as the targets, failing part size,
falling distance and target zone (6, 7, 31), influence consequence (i.e. damage caused
by the part of the tree that affects the targets, 19).
As mentioned,
risk rating is calculated in quantitative, qualitative, or semiquantitative
terms (6, 13, 20). In quantitative terms, real values are
estimated for consequences and likelihoods. For qualitative assessment,
expressions such as “low”, “moderate”, and “high” are used. Finally,
semiquantitative risks may be a sum or multiplication of the components,
associated with a scale, whether linear, logarithmic, or other. Nonetheless,
finding methodologies that use different scales for different components, is possible (9).
Regardless of
the method used, risk assessment should reduce uncertainty and help manage the
risk. This should be of assistance in deciding whether to adhere to an existing
method or adapt a previous one, particularly in the case of those countries
that do not possess their own (26). Therefore,
method evaluation tests different factors, assessors, trees, and sites,
ensuring adequate reliability and repeatability (17, 18,
19, 22, 26).
Studies show
significant differences when comparing risk ratings of different visual
assessment methods (3, 22, 26) and assessor performance (3, 19,
22). Furthermore, when
analyzing each component, some authors (19) observe greater variability in likelihood of
impact than in likelihood of failure.
Considering
that the methods available were developed in Anglo-Saxon countries, in other
countries, especially in Latin America (1), method adaptation or development is still
incipient, with few available studies (3, 4, 14, 26).
The aim of this
article is to compare three methods of UT visual risk assessment qualifying
their performance and possible adaptation to assess UT in Montevideo city.
Materials
and methods
Fieldwork was
carried out in December 2018, by assessing streets in different neighborhoods
of Montevideo (34°54’04.3” S, 56°08’18.4” W and 136 m a. s. l.), Uruguay.
Average temperatures range from 11°C in winter to 21.5°C during summer.
Precipitation is spatially irregular and variable, presenting a maximum in
autumn and a secondary maximum in spring (11). Northbound winds are the most frequent but
less intense (< 65 km/h) while south-southeast and west-northwest winds are
the most intense (> 80 km/h) (12).
In 2012, the
city of Montevideo had 211,402 sidewalk trees, totaling 422 species (30). Four species within the most cultivated
genera in Montevideo, were selected (30): Melia azedarach L., Fraxinus
excelsior L., Fraxinus pennsylvanica Marshall and Platanus x acerifolia
(Aiton) Willd. The decision was based on a registry of tree failures during
storms in the 2012 - 2017 period, indicating that
these species have failed the most. For this research, 36 trees were selected,
12 of each genus, with different scenarios of likelihood of failure, impact,
and consequence, incorporating trees at all possible risk levels.
Three visual
risk assessment methods were selected: “Quantified Tree Risk Assessment” (8), “Best Management Practices - Tree Risk
Assessment” (6) and “Tree
Hazard: Risk Evaluation and Treatment System” (9), so that all types of methodologies
(quantitative, qualitative and semiquantitative) were considered (Table 1).
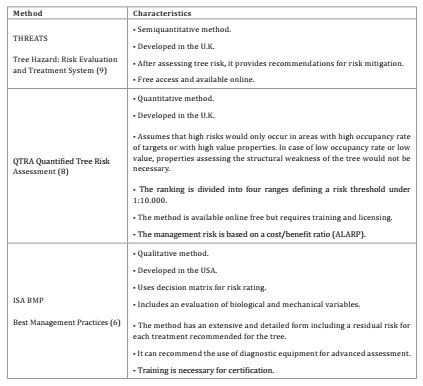
Table 1: Method characteristics.
Tabla 1: Características de los métodos.
Risk ratings
and the use of methods focused on street trees were also considered. These last
considerations, along with assessor training, were decisive in the
methodological selections.
The assessment
methods used provide different final risk ratings, and evaluate each component,
resulting in different qualitative scales or quantitative evaluations. For that
reason, data analysis was standardized according to Coelho-Duarte
et al. (2021).
Due to the
limited availability of trained personnel, three assessors with basic knowledge
in arboriculture applied the methods. These people received prior training
consisting of theoretical and practical capacitation, totalizing about fourteen
hours.
Each tree was
measured considering height (m), diameter at breast height (DBH) (m) and crown
projection diameter in N-S and E-W directions (m).
Three
hundred and twenty-four assessments were analyzed. ANOVA considered the
methods, genera, assessors, and the interaction between them as sources of
variation. For the ANOVA, a generalized linear mixed model (p < 0.05)
selected “tree” effect as random factor, since the three methods were applied
in the same trees. When significant differences were found, means were compared
using Fisher’s Least Significant Difference (LSD) test (α = 0.05). The data
were analyzed with the glmer function of R’s lme4 library (25),
interconnected to InfoStat software version 2020 (5).
Plots were developed using SigmaPlot software version 12 (Systat Software
Inc.).
Results
The
studied trees had different crown sizes given by reduction pruning intended to
adequate size to the available space. Specimens of Platanus were mostly
located in avenues with wide sidewalks and were considerably larger in height
and crown diameter than Melia trees, which were more abundant in streets
with narrower sidewalks. Fraxinus individuals were of smaller size, with
lower DBH than the other genera (Table 2).
Table
2: Mean dendrometric values
per genus.
Tabla 2: Valores promedios de las medidas
dendrométricas por género.
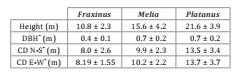
*DBH = Diameter at Breast Height; CD N-S = Crown Diameter N-S; CD
E-W: Crown Diameter E-W.
*DBH = Diámetro a la Altura del Pecho; CD N-S = Diámetro
de Copa N-S; CD E-W: Diámetro de Copa E-O.
Regarding
risk assessments, no interactions were found between factors. The results
showed significant differences among methods only for likelihood of impact (p =
0.016) and risk rating (p = 0.046) (Figure 1b and Figure 1d).
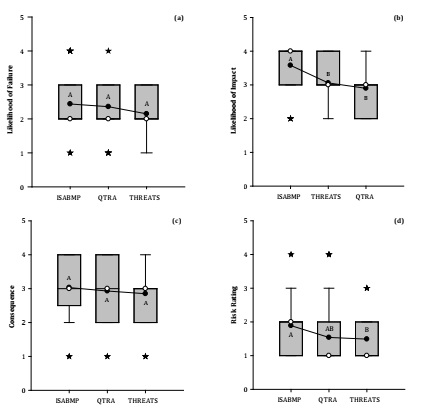
Black points represent the adjusted mean; stars depict outliers;
white circles show medians. Dissimilar letters denote statistically significant
differences in mean ratings for LSD Fisher test (α = 5%).
Puntos negros representan la media ajustada;
estrellas negras son valores atípicos; letras diferentes denotan diferencias
estadísticamente diferentes en las medias determinadas con una prueba de LSD
Fisher (α = 5%)
Figure 1: Boxplot (bars):
(a) likelihood of failure, (b) likelihood of impact, (c) consequence, and (d)
risk ratings for the three methods of visual assessment.
Figura 1: Diagrama de caja (barras): (a) probabilidad
de falla, (b) probabilidad de impacto, (c) consecuencia, (d) clasificación del
riesgo para los tres métodos de evaluación visual.
Among
genera, differences were only found for likelihood of impact (p = 0.013) (Figure 2), while no significant
differences were found among assessors for any of the components.
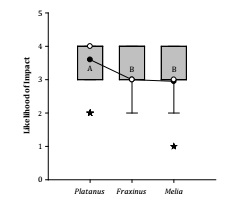
Black points represent adjusted mean; stars depict outliers; white
circles are medians. Dissimilar letters denote statistically significant
differences in mean ratings as determined with LSD Fisher test (α = 5%).
Puntos negros representan la media ajustada;
estrellas negras son valores atípicos; letras diferentes denotan diferencias
estadísticamente diferentes en las medias determinadas con una prueba de LSD
Fisher (α = 5%).
Figure 2: Boxplot (bars):
likelihood of impact by genus.
Figura 2: Diagrama de cajas (barras): probabilidad de
impacto por género.
Results
per component
Likelihood
of failure
No
significant differences were found for any factor. Results distribution showed
94.4% (QTRA), 93.5% (ISA BMP) and 85.2% (THREATS) in the standardized indices 2
and 3 (Figure 3).
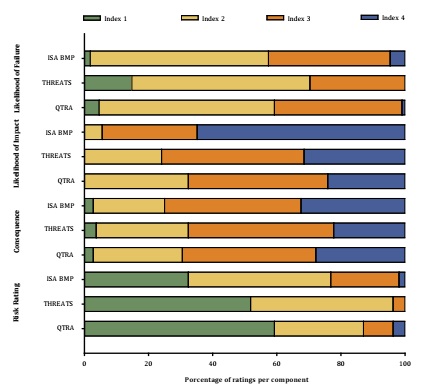
Figure 3: Assessment
distribution by component for three methods (ISA BMP, THREATS and QTRA).
Figura 3: Distribución de las evaluaciones por
componente para tres métodos (ISA BMP, THREATS y QTRA).
Essentially,
likelihood of failure of the evaluated individuals was possible/ probable. It
must be noted that for the THREATS method, 14.8% of the assessments are located
in the standardized index 1, referring to defect absence or minor defect
presence, and none in index 4, which represents an imminent failure.
Likelihood
of impact
The
methods resulted in two homogeneous groups for this component (Figure 1b), with the ISA BMP method
bringing about the highest mean. None of the methods resulted in the standardized
index 1. For QTRA and THREATS the distribution was similar within the
standardized indices 2, 3 and 4, while in ISA BMP 64.8% of the results were in
the standardized index 4 (Figure 3). For both QTRA and THREATS it was possible to
discriminate the highest occupancy rates effectively (Figure
4).
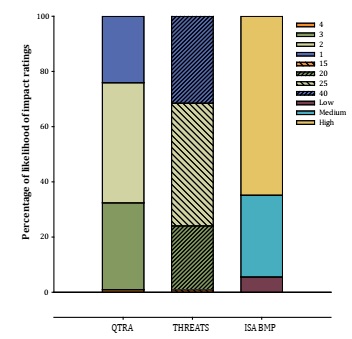
Figure 4: Assessment
distribution using original ranges in each method (QTRA: 1, 2, 3, 4; THREATS:
15, 20, 25, 40; ISA BMP: Low, Medium, High) for likelihood of impact.
Figura 4: Distribución de las evaluaciones utilizando
los rangos originales de cada método (QTRA: 1, 2, 3, 4; THREATS: 15, 20, 25,
40; ISA BMP: Low, Medium, High) para la probabilidad de impacto.
Consequence
No significant
differences were found among factors. Thus, for the “most likely-to-fail part”,
branches represented 77%, 95% and 74% in Fraxinus, Platanus and Melia
respectively; while 23%, 24% and 5% resulted for the trunk. As for the
entire tree, only Melia had a 2% of the total assessments. Concerning branches,
valuations fluctuated, between 11 and 16 cm.
Risk
rating
The methods
yielded two groups, with significant differences between ISA BMP and THREATS (Figure 1d). ISA BMP resulted in “moderate” risk, even when the other
components had the highest values amongst these results, No ratings were found
in the “extreme” category for the THREATS method.
Discussion
Other studies
had found similar results when considering the same methods (3), with the addition of significant
differences for likelihood of failure. Significant differences among the genera
for the likelihood of impact (Figure 2) could be explained by tree
location since Platanus sp. were located on avenues where vehicle and
pedestrian circulation is constant, while Fraxinus sp. and Melia sp.
were located in low-traffic streets.
The lack
of significant differences among assessors for any of the components differs
from previous results (3,
19).
However, further perception studies state that individuals of equal age (16),
gender, educational level (16,
28), and
social ties (27) tend to judge possible
risks in a similar way, explaining our results.
Discussion
per component
Likelihood
of failure
The THREATS
method presented a different dispersion, in accordance with Coelho-Duarte et al. (2021). Assessor equal
training level at the moment of categorizing likelihood of failure could
explain the observed non-significant differences. In this regard, other authors
(19) founding
differences among assessors for this likelihood, highlighted the component as
presenting the lowest variability among them. A different research
distinguished knowledge levels among assessors, finding differences in
likelihood of failure between a more experienced group and a less experienced
one (3).
Likelihood
of impact
The lack of
results for the standardized index 1 for all methods,
could be explained by the “rare occupancy” rate of street trees. The distinct
predomination of index 4 for ISA BMP may be due, on the one hand, to the fact
that the ISA BMP proposes four categories to assess the impact, while the other
tested methods propose six, resulting to be more similar. On the other hand,
the difference could be also due to the standardization, which might allow the
other two methods a better discrimination between the highest categories.
Therefore, the qualitative assessment of the ISA BMP method could be
overestimating this component, as previously found (3).
For a more
precise measurement of the occupancy rate, traffic counters have been proposed (15), reducing variability among methods, after
reducing assessor subjectivity.
Consequence
As each method
has a particular way of consequence evaluation in terms of tree-part size and
the attributes to be considered, significant differences were expected among
them. No difference, as already observed (3), may be associated with the branches being
the part with the highest likelihood of failure in most of the assessments.
No significant
differences among assessors in consequence analysis differ from that previously
reported (19), where the
second component showed the highest variability among assessors.
Risk
rating
When observing
the ISA BMP matrix and the obtained risk rating (6), most of the possible combinations between
components resulted in “low” risk level.This explained that the final average
resulted lower than individual risk components.
Low ratings in
the “extreme” category for THREATS (index 4, Figure 3) could be influenced by the likelihood of failure
component, as indicated by Coelho-Duarte et al. (2021).
Regarding the
observed assessment dispersion (Figure 1d),
the ISA BMP and QTRA methods resulted in the more adequate tree risk
classifications, with a reduced number of trees at the “extreme” level,
similarly to that previously found (3). The difference between both methods is that QTRA resulted
in 59.2% of the assessments at “low” level (Figure 3), in which the trees would not need treatment, while ISA
BMP yielded 44.4% “moderate” level, where treatment depends on the benefits
outweighing handling costs (8).
Unlike that
reported in other studies (3, 19, 22) in our study,
risk assessors were not significantly different from each other. In this
context, the used basic visual assessment methods proved to efficiently
determine tree fall risks, complying with that already proposed (22). However, in the case of Montevideo, not all
methods resulted completely appropriate. Some of the descriptors used do not
apply to meteorological conditions and city infrastructure, such as urban
furniture, pedestrian and vehicular transport, and space for the tree itself, amongst
others.
Considering the
abovementioned, we observed that the ISA BMP method resulted in the best
option, with defect analysis in depth and residual risk designation. When recommending management, the THREATS method is the only
presenting a list of treatments, stipulating a period for their performance and
re-inspection. It is stated that the qualitative features of this method
use some ambiguous descriptors (22), thus, any suggested treatment could not be
necessary when ambiguously interpreting them. For its part, the QTRA method
provided few details during the assessment, probably making subsequent risk
management more difficult, but considering consequent risk costs (8).
The lack of
certified arborists for tree risk assessment is evident in many cities of the
Latin American Region. In this case, the number of assessors is compensated by
the amount of data analyzed, reason for considering the methodology as adequate
for the exploratory and descriptive characteristics of this research.
Therefore, we recommend increasing the number of assessors and trees in future
research.
Conclusions
No significant
differences were found among assessors, allowing the application of these
methods by those with similar training level. Additionally, this would constitute
encouraging standard trainings for all assessors.
Methods for the
likelihood of impact and risk rating showed significant differences. In both
cases, the ISA BMP method presented the highest results, being the most
relevant comparison aspects.
Differences
among genera were found for the likelihood of impact component, influenced by
target occupation rate and characteristics.
Compared to the
ISA BMP The QTRA and THREATS methods, in the highest
categories of likelihood of impact, distinguished two ranges.
The absence of
descriptors and categorizations, and application time resulted characteristics
to be improved, where ISA BMP exceeded the limit for application time. Still,
ISA BMP method is suggested for street trees risk assessment in Montevideo, until
an appropriate method including treatment recommendations and guidelines for
risk management is adapted or developed.
Regardless of
the method used, we suggest complementing visual assessment with advanced
equipment for those trees classified as higher risks.
Acknowledgments
We would
like to thank the Comisión Sectorial de Investigación Científica (CSIC) and
Universidad de la República (Uruguay). We also thank all the professionals who
participated, along with the Montevideo Municipality for the authorization and
support to carry out this work, and Mike Ellison for sending QTRA’s calculator
and allowing its use during this research.
1. Calaza, P. 2015. Trees in urban ecosystem: connection between
new urbanism, society and rational risk management. In
Ingeniería y Universidad. Colombia. 20(1): 155-173. DOI:
10.11144/javeriana.iyu20-1.tuec.
2. Calaza, P.; Iglesias, M.I. 2016. El
riesgo del arbolado urbano: contexto, concepto y evaluación. (Eds). Mundi-Prensa. Madrid, España. 503 p.
3. Coelho-Duarte, A. P.; Daniluk-Mosquera, G.; Gravina, V.;
Vallejos-Barra, O.; Ponce-Donoso, M. 2021. Tree Risk Assessment: component
analysis of six visual methods applied in an urban park, Montevideo, Uruguay. In Urban Forestry & Urban Greening. Germany. 59:127005.
DOI: 10.1016/j.ufug.2021.127005.
4. Coelho-Duarte, A. P.; Daniluk-Mosquera, G.; Gravina, V.;
Hirigoyen, A.; Vallejos-Barra, O.; Ponce-Donoso, M. Proposal of two visual tree
risk assessment methods for urban parks in Montevideo, Uruguay. In Bosque. Chile. 42(2): 259-268. DOI:
10.4067/S0717-92002021000200259.
5. Di Rienzo, J. A.; Casanoves, F.; Balzarini, M. G.; Gonzalez,
L.; Tablada, M.; Robledo, C. W. 2020. InfoStat Version 2020.
Centro de Transferencia InfoStat, FCA, Universidad Nacional de Córdoba,
Argentina. Available in: http://www.infostat.com.ar (Accessed July 2020).
6. Dunster, J.; Smiley, E. T.; Matheny, N.; Lilly, S. 2017. Tree
risk assessment: manual. 2nd.ed. International Society of
Arboriculture. Chicago, IL, USA. 194 p.
7. Ellison, M. 2005. Quantified Tree Risk Assessment used in the
management of amenity trees. In Journal of Arboriculture.
United States. 31(2): 57-65.
8. Ellison, M. 2018. Quantified Tree Risk Assessment: Nota de
procedimiento V5.2.3(ES)2018-01. Quantified
Tree Risk Assessment Limited. United Kingdom. 10 p.
9. Forbes-Laird, A. 2010. Tree Hazard: Risk Evaluation and
Treatment System: a method for identifying, recording and managing hazards from
trees. Dendron House. United Kingdom. 16 p.
10. Hamstead, Z.; Kremer, P.; Larondelle, N.; McPhearson, T.;
Haase, D. 2016. Classification of the heterogeneous structure of urban
landscapes (STURLA) as an indicator of landscape function applied to surface
temperature in New York City. In Ecological Indicators.
Netherlands. 70: 574-585, DOI: 10.1016/j.ecolind.2015.10.014.
11. Instituto Uruguayo De Meteorología. Climatología
en Uruguay 1981-2010. Available in: https://www.inumet.gub.uy/clima/climatologia-estacional (Accessed
July 2020).
12. Intendencia de Montevideo. 2006. Plan de saneamiento urbano
etapa IV -PSU IV. Intendencia de Montevideo. Montevideo, Uruguay. 282 p.
13. ISO 31000. 2018. Gestión del Riesgo -
Directrices (Traducción oficial). International Standards
Organization. Geneva, Switzerland. 26 p.
14. Ivasko, J.; Biondi, D.; Ximenes, E.; Nunho, A.; Heck, B. 2019.
Risk assessment of trees protected by law in Curitiba squares, Paraná, Brazil. In Bosque. Chile. 40(3): 347-354. DOI:
10.4067/s0717-92002019000300347.
15. Klein, R. W.; Koeser, A. K.; Hauer, R. J.; Hansen, G.;
Escobedo, F. J. 2016. Relationship between perceived and actual occupancy rates
in urban settings. In Urban Forestry & Urban Greening.
Germany. 19: 194-201. DOI: 10.1016/j.ufug.2016.06.030.
16. Klein, R.; Koeser, A.; Hauer, R.; Hansen, G.; Escobedo, F.
2019. A Review of Tree Risk Assessment and Risk Perception
Literature Relating to Arboriculture and Urban Forestry. In Arboriculture & Urban Forestry. United States. 45(1):
26-38.
17. Koeser, A. K.; Hasing, G.; McLean, D.; Northrop, R. 2016. Tree
Risk Assessment Methods: A Comparison of Three Common Evaluation Forms.
Available in: https://edis.ifas.ufl.edu/ep487 (Accessed July 2020).
18. Koeser, A. K.; Hauer, R. J.; Klein, R. W.; Miesbauer, J. W.
2017. Assessment of likelihood of failure using limited visual, basic, and
advanced assessment techniques. In Urban Forestry & Urban
Greening. Germany. 24: 71-79. DOI: 10.1016/j.ufug.2017.03.024.
19. Koeser, A. K.; Smiley, E. T. 2017. Impact of
assessor on tree risk assessment ratings and prescribed mitigation measures.
In Urban Forestry & Urban Greening. 24: 109-115.
DOI: 10.1016/j.ufug.2017.03.027.
20. Matheny, N.; Clark, J. 1994. A photographic
guide to the evaluation of hazard trees in urban areas. 2nd. ed. International Society of Arboriculture. Savoy, IL,
USA. 85 p.
21. Miller, R. W.; Hauer, R. J.; Werner, L. P. 2015. Urban
forestry: planning and managing urban greenspaces. Waveland Press Inc. Long
Grove, IL, USA. 560 p.
22. Norris, M. 2010. A Review of Methods Used to Undertake Risk
Assessments of Urban Trees. Thesis M. Sc. University of
Melbourne. Australia. 400 p.
23. Pokorny, J. 2003. Urban tree Risk management: A Community
Guide to Program and Implementation. USDA Forest Service.
St. Paul, MN, USA. 194 p.
24. Ponce-Donoso, M.; Vallejos-Barra, O.; Ingram, B.;
Daniluk-Mosquera, G. 2020. Urban trees and environmental variables:
relationships in a city of central Chile. In Arboriculture
& Urban Forestry. United States. 46(2): 84-95.
25. R Core Team. 2019. R: A Language and Environment for
Statistical Computing (R Foundation for Statistical Computing). Available in: https://www.r-project.org/ (Accessed July 2020).
26. Reyes de la Barra, J.; Ponce-Donoso, M.; Vallejos-Barra, O.;
Daniluk-Mosquera, G.; Coelho-Duarte, A. P. 2018. Comparación
de cuatro métodos de evaluación visual del riesgo de árboles urbanos. In Colombia Forestal. Colombia. 21(2):161-173.
DOI: 10.14483/2256201X.12604.
27. Scherer, C.; Cho, H. 2003. A Social Network
Contagion Theory of Risk Perception. In Risk Analysis.
United Kingdom. 23(2): 261-267. DOI: 10.1111/1539-6924.00306.
28. Slovic, P. 2010. The Feeling of Risk: New perspectives on Risk
Perception. Routledge. London, United Kingdom. 456 p.
29. Smith, I.; Dearborn, V.; Hutyra, L. 2019. Live fast, die
young: Accelerated growth, mortality, and turnover in street trees. PLoS ONE. United States. 14(5): e0215846. DOI:
10.1371/journal.pone.0215846.
30. Terrani, E. 2014. Evaluación de la
estructura y comportamiento del arbolado urbano en Montevideo. Thesis B. Sc. Universidad de la República. Montevideo,
Uruguay. 135 p.
31. Tomao, A.; Secondi, L.; Corona, P.; Giuliarelli, D.; Quatrini,
V.; Agrimi, M. 2015. Can composite indices explain multidimensionality of tree
risk assessment? A case study in an historical monumental
complex. In Urban Forestry & Urban Greening.
Germany. 14(3): 456-465. DOI: 10.1016/j.ufug.2015.04.009.
32. Vogt, J.; Hauer, R.; Fischer, B. 2015. The costs of
maintaining and not maintaining the urban forest: A review of the urban
forestry and arboriculture literature. In Arboriculture &
Urban Forestry. United States. 41(6): 293-323.