Revista de la Facultad de Ciencias
Agrarias. Universidad Nacional de Cuyo. Tomo 55(1). ISSN (en línea) 1853-8665.
Año 2023.
Original article
Biometric genetics in Cowpea beans (Vigna unguiculata (L.)
Walp) I: phenotypic and genotypic relations among production components
Genética biométrica en Caupí (Vigna unguiculata (L.) Walp)
I: relaciones fenotípicas y genotípicas entre componentes de producción
Francisco Cássio Gomes Alvino
1
Rodolfo Rodrigo de Almeida
Lacerda 2
Leonardo de Sousa Alves 3
Lauter Silva Souto 2
Rômulo Gil de Luna 2
Marcelo Cleon de Castro Silva
2
Jussara Silva Dantas 2
Jabob Silva Souto 4
Diogo Gonçalves Neder 5
João de Andrade Dutra Filho
6*
Anielson dos Santos Souza 2
1 Federal University of
Viçosa. Department of Agricultural Engineering. Av. Peter Henry Rolfs s/n.
Campus Universitário. CEP: 36570-900. Viçosa. Paraíba. Brazil.
2 Federal University of
Campina Grande. Agri-Food Science and Technology Center. Rua Jairo Vieira
Feitosa. 1770. Pereiros. CEP: 58840-000. Pombal. Paraiba. Brazil.
3 Federal Rural University
of the Semiarid. Department of Plant Sciences. Rua Francisco Mota 572. Pres.
Costa e Silva. CEP: 59625-900 Mossoró. Rio Grande do Norte. Brazil.
4 Federal University of
Campina Grande. Forestry Engineering Academic Unit. University Avenue s/n.
Santa Cecília 58700970. Patos. Paraíba. Brazil.
5 Campina Grande State
University. Rua Baraúnas, 351. CEP: 58429-500. Campina Grande. Paraíba. Brazil.
6
Federal University of Pernambuco. Vitoria Academic Center/ Biological Science
Nucleus. Rua Alto do Reservatório. s/n Bela Vista.
CEP: 55608-680. Vitória de Santo Antão. Pernambuco. Brazil.
* joao.dutrafilho@ufpe.br
Abstract
In the semi-arid region of
Paraíba, cowpea has low productivity due to irregular rainfall and poor use of
production technologies. An extensive study aimed at selecting more productive
cultivars was conducted using biometric models. This first work had the
following objectives: i. Quantify direct and indirect effects of primary and
secondary components on grain production; ii. Identify variables with greater
potential for cultivar selection in the semiarid region of Paraíba and iii.
Determine the most appropriate selection strategies for the evaluated
variables. The experiment was conducted in an experimental field. The influence
of 6 primary and 6 secondary production components was evaluated on grain
yield. Data were subjected to ANOVA. Genetic parameters, correlations and path
analysis were estimated. Given the strong direct phenotypic and genotypic
effects, pod yield results the most promising variable for higher grain yield
selection. Direct and simultaneous selections are the most suitable strategies
for the set of evaluated variables. However, further studies on selection
indices are necessary to maximize genetic gains.
Keywords: Path analysis; Genetic improvement; Selection; Productivity; Relationships among
characters;
Vigna
unguiculata (L.) Walp.
Resumen
En la región semiárida de
Paraíba, el caupí es el principal producto de la agricultura familiar. El
cultivo tiene baja productividad debido a lluvias irregulares y condiciones
climáticas desfavorables. Además, la productividad también se ve afectada por
el uso deficiente de las tecnologías de producción. Con el objetivo de superar
estas limitaciones y aumentar la eficiencia de la selección de cultivares
superiores, se llevó a cabo un extenso estudio utilizando modelos biométricos
en caupí. Este primer trabajo tuvo los siguientes objetivos: i. Cuantificar los
efectos directos e indirectos de los componentes primarios y secundarios en la
producción de granos; ii. Identificar variables con mayor potencial para la
selección de cultivares de caupí en la región semiárida de Paraíba y iii.
Determinar las estrategias de selección más adecuadas para el conjunto de
variables evaluadas. El experimento se llevó a cabo en un campo experimental en
el Centro de Ciencia y Tecnología Agroalimentaria de la Universidad Federal de
Campina Grande. Se evaluó la influencia de 6 componentes primarios y 6
componentes secundarios de la producción sobre la variable rendimiento de
grano. Los datos se sometieron a ANAVA y se estimaron parámetros genéticos.
También se realizaron correlaciones y análisis de ruta. Se identificaron
variables con mayor potencial para la selección de cultivares superiores de caupí
en la región semiárida de Paraíba. Se encontró que la variable rendimiento de
vaina es la más prometedora para la selección de cultivares con mayor
rendimiento de grano debido a la magnitud de los efectos fenotípico y
genotípico. La selección directa y la selección simultánea son las estrategias
más adecuadas para el conjunto de variables evaluadas. Sin embargo, para
maximizar las ganancias genéticas, se continuó el estudio a través de índices
de selección.
Palabras clave: Análisis de ruta; Mejoramiento genético; Selección; Productividad; Relación entre caracteres; Vigna unguiculata (L.) Walp.
Originales: Recepción: 26/08/2021
Aceptación:
28/06/2023
Introduction
Among the annual crops
traditionally cultivated by small and medium farmers in the Northeast region of
Brazil, cowpea (Vigna unguiculata, L. Walp), also called macassar
bean or green bean according to the location, stands out with economic, social
and food importance. Cowpea is one main source of employment and income for
rural population, besides being rich source of vegetable protein, daily
consumed in a variety of dishes (43). Grains constitute
important sources of protein, amino acids and dietary fiber, considered for
public policy programs focused on improving life quality (44).
Irregular rainfall and
traditional farming, highly dependent on labor and little use of agricultural
inputs, have recurrently promoted low yields, with 328 kg ha-1 on average in the Northeast and
366 kg ha-1
in Brazil (30). For Oliveira
et al. (2001), low productivity levels are mainly given by
traditional cultivars with low agronomic quality. Measures promoting cultivar
identification and greater adaptation would determine the revitalization of the
culture’s productive chain (33).
According to Ferreira et al. (2007), understanding the
relationships among variables related to productivity is key for cultivar
identification and selection. Besides, knowing these relationships allows the
indirect selection of hard-to-measure variables with low heritability by
considering another simpler-to-assess and associated variable (14).
Phenotypic correlation
measures the association between two variables (21). This correlation has two known origins: genetic and
environmental. When a gene conditions more than one variable, the genetic
correlation is known as pleiotropy (16).
According to Nogueira et al. (2012), correlations are not
measures of cause and effect. Determining a selection strategy based on a
direct interpretation of correlation values can compromise the achievement of
superior cultivars. In other words, high correlations between two variables may
result in indirect effects of a third variable. In this case, other
methodologies, such as partial correlations or path analysis, are better
choices (25, 48, 49).
In this sense, path analysis uses
regression equations to unfold the direct and indirect effects of a set of
variables on a basic or main variable (11), determining the most suitable
selection strategy for each variable and identifying the most promising
cultivar.
Available literature mentions correlation studies and path
analysis on cowpea (19, 35, 42). However,
new sets of variables in path analysis with chain diagrams should be further
studied in order to identify easy-to-measure yield components with high
heritability (2, 47).
Given the above, this work aimed to quantify the direct and
indirect effects of primary and secondary components on grain production,
identifying selection strategies of greater potential for cultivar selection in
the semiarid region of Paraíba.
Material and methods
The experiment was carried out in an experimental field at the
Center for Agri-food Science and Technology, Federal University of Campina
Grande, CCTA/UFCG, Campus de Pombal - Paraíba. With geographic coordinates
06°46’ south latitude, 37°48’ west longitude of the Greenwich Meridian (3). According to Köppen’s
classification, the climate is Aw, semi-arid, with average annual rainfall of
800 mm, and February, March and April concentrating 60 to 80% of total annual
precipitation (29).
Before the experiment, plowing was carried out 15 days before
sowing, followed by cross harrowing 5 days before bean planting, providing weed
control and conditions for good germination. Soon after this procedure, the
plots were marked and distributed in the field. Sowing was done in manually
opened holes with a hoe at approximately 5 cm depth, placing three seeds per
hole. Spacing was 0.5 m with five plants per linear meter.
Fertilization was according to the Fertilization and Liming
recommendations for the state of Ceará (17). Thinning occurred about 15 days
after emergence, keeping two plants per hole. For pest management, Dimethoate
was sprayed twice at a dosage of 1.0 liter/ ha, against aphid (Apis
cracyvora Koch) and thrips (Order Thysanoptera), Methomyl was sprayed once
at 0.5 liter/ha against caterpillars (Spodoptera frugiperda) and
Imidacloprid and Beta-cyfluthrin, once at 270 g/ha to control whitefly (Order
Hemiptera).
The experimental design consisted of randomized blocks with eight
treatments and four replications, totaling 32 experimental units, with 2.0 m
between blocks and plots. The treatments consisted of eight cultivars of
cowpea, namely: Costela de Vaca, BRS Marataoã, BRS Itaim, BR-17 Gurguéia, BRS
Novaera, Paulistinha, Setentão and BRS Patativa.
Each experimental plot was 3m x 3m (9 m2) with six rows
of plants and a useful area of 2m x 2m (4 m2). Spacing between rows
was 0.5 meters, with fifteen holes and two plants. Two lateral rows were
considered borders. Data collection was carried out in the third and fifth
rows.
Cultivar evaluation involved the study of phenology. Precocity was
evaluated by considering initial flowering (FL) and initial fruiting (DAFFF),
determined by the number of days between sowing and flowering until 50% of the
studied plants had at least one flower or an open pod, respectively. Precocious
plants reach full flowering 70 days after sowing. Then, the number of days
between flowering and fruiting (DAFFH) was calculated.
Harvest of dry pods was manually performed. At harvest time, yield
components were measured: total number of pods per plant (TNP); pod unit mass
(PUP), in kilograms; pod length (PL), in cm; pod diameter (PD) in mm with the
aid of a caliper; pod grain number (NGP), counting the grains of a sample of 10
pods; number of pods per plant (NPP), obtained by the ratio between total pods
and number of plants; grain yield (GY) in tons ha-1; pod bark
productivity (SS), in tons ha-1; pod yield (PP), in tons ha-1, and
seed/pod ratio (PSR), as the ratio between total grain mass and pod number.
The collected data were subjected
to ANOVA, and genetic parameters were estimated (10). The correlations and
phenotypic, genotypic and environmental trail analysis were performed as
described by Cruz et al. (2012). For
correlations and path analyses, grain yield (GY) was classified as a basic or main
variable. The variables TNP, PUP, PL, PD, NGP and NPP were classified as
primary components of production, while SS, POS, PSR, FL, DAFFF and DAFFH were
classified as secondary components of production. Thus, the path analysis
followed a chain diagram scheme (Figure 1).
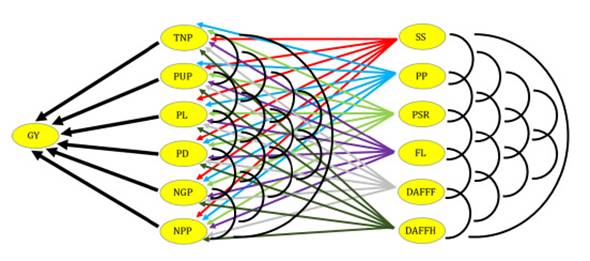
Figure 1: Causal diagram
illustrating the direct and indirect effects of secondary components on primary
components and grain yield in cowpea.
Figura 1: Diagrama de causas que
ilustra los efectos directos e indirectos de los componentes secundarios sobre
los componentes primarios y el rendimiento de grano en caupí.
Heritability coefficients
and measurement allowed variable classification into primary and secondary
components. More complex variables, with low heritability and selection
difficulty, were classified as primary components. Those with high heritability
and easy to measure were classified as secondary components.
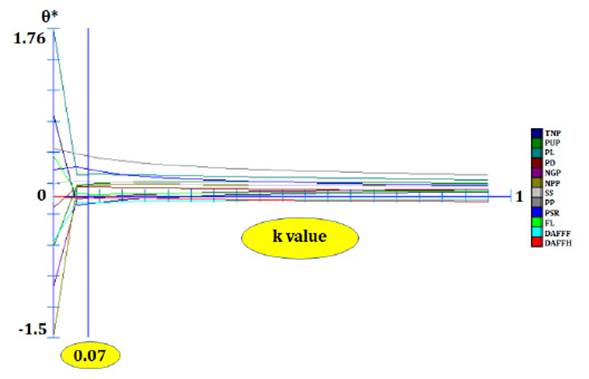
Before the path analysis, all
variables were submitted to multicollinearity diagnosis by verifying the
condition number (NC) as established by Montgomery and Peck
(1981). Once severe multicollinearity was verified, the crest regression
analysis (8)
established a constant k (Figure 2).
All genetic-statistical analyses were performed by Genes software
(Cruz 2012).
Todos los análisisenético-estadísticos fueron interpretadosor
Genes software (Cruz, 2012).
Figure 2: Estimates of path
coefficients (θ*) as a function of k values and obtained in the analysis using
grain yield as the basic variable.
Figura 2: Estimaciones de los coeficientes de ruta (θ *) en función de los
valores k y obtenidos en el análisis utilizando el rendimiento de grano como
variable básica.
Results
The ANOVA showed
significant differences between variables except for TNP, PUP and NPP. The
coefficient of variation ranged between low, for FL, and very high, for TNP (Table 1).
Table 1: ANOVA of variables evaluated in an experimental field at the
Center for Agri-food Science and Technology of the Federal University of
Campina Grande in the city of Pombal - Paraíba.
Tabla 1: ANOVA de variables evaluadas en campo experimental del Centro de
Ciencia y Tecnología Agroalimentaria de la Universidad Federal de Campina
Grande en la ciudad de Pombal - Paraíba.
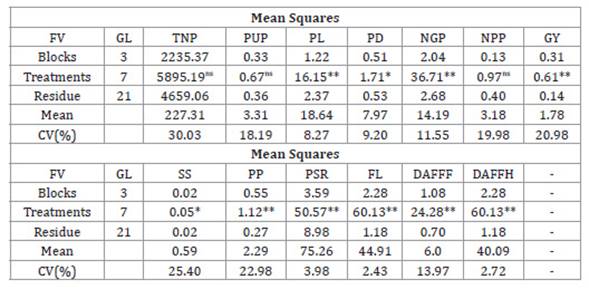
** and * significant at 1 and 5%
probability; respectively; by F test; ns non-significant; by F test
** y * significativo al 1 y 5% de probabilidad;
respectivamente; por prueba F; ns no significativo; por prueba F
Regarding genetic
parameters, the genotypic variance exceeded the environmental variance for
variables PL, NGP, PSR, FL, DAFFF and DAFFH (Table 2).
Table 2: Estimates of genetic parameters of the evaluated variables in an
experiment conducted at the Center for Food Science and Technology of the
Federal University of Campina Grande in the city of Pombal - Paraíba.
Tabla 2: Estimaciones de parámetros genéticos de las variables evaluadas en
el campo experimental del Centro de Ciencia y Tecnología de Alimentos de la
Universidad Federal de Campina Grande en el municipio de Pombal - Paraíba.
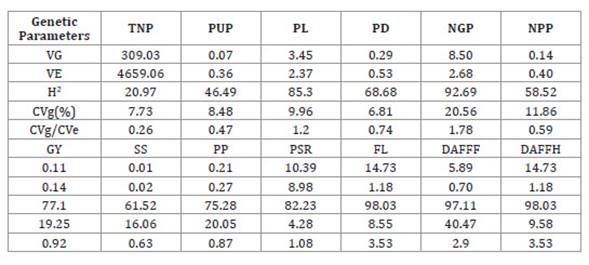
Heritability coefficients
showed high magnitude for PL, NGP, GY, PP, PSR, FL, DAFFF and DAFFH; average
magnitude for PD, NPP and SS; and low magnitude for TNP and PUP.
The genotypic coefficients of
variation exceeded 10 for NGP, NPP, GY, SS, PP, DAFFPF and DAFFH. Also, for PL,
NGP, PSR, FL, DAFFF and DAFFH, the b index, i.e. the ratio between genotypic
variation coefficient and experimental variation coefficient (CVg/CVe),
exceeded unity.
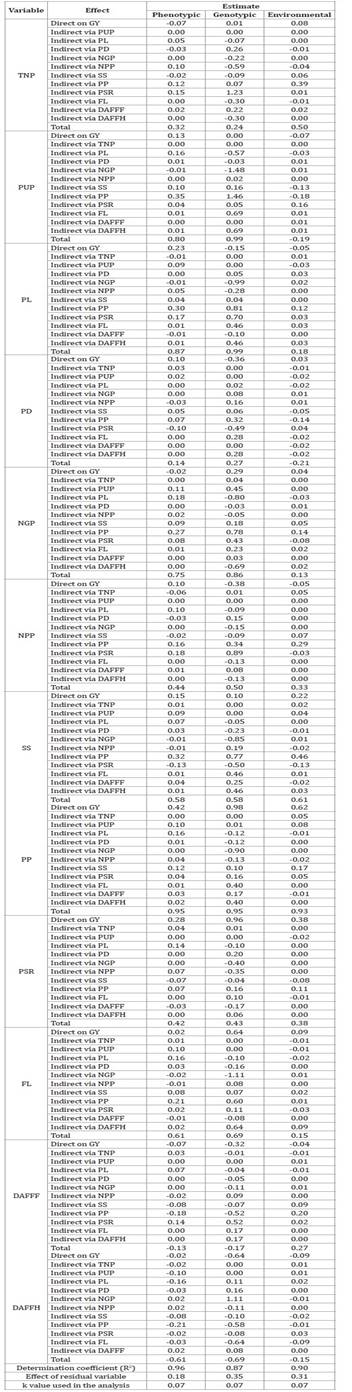
Table 3 shows direct and indirect effects of the explanatory
variables on grain yield per hectare. Even with multicollinearity, the crest
regression analysis showed high precision considering determination
coefficients, residual effects and the adjustment of the k constant.
Table 3: Phenotypic, genotypic and environmental path analysis among the
explanatory variables.
Tabla 3: Correlaciones fenotípicas, genotípicas y ambientales entre las
variables explicativas.
Total number of pods (TNP), pod unit mass (PUP), pod length (PL),
pod diameter (PD), pod grains number (NGP ), number of pods per plant (NPP),
pod yield per hectare (SS), pod yield per hectare (PP), seed to pod ratio
(PSR), flowering (FL), days after flowering to fruiting (DAFFF), days after
flowering for fresh harvest (DAFFH) and the basic variable grain yield per
hectare (GY), evaluated in cowpea cultivars in an experiment conducted in
Pombal - PB.
Número
total de vainas (NTV), unidad de masa de vaina (MUV), longitud de vaina
(COMPV), diámetro de vaina (DIAMV), número de granos de vaina (NGVA), número de
vainas por planta (NVPL), rendimiento de corteza por hectárea (PDC),
rendimiento de vaina por hectárea (PDV), proporción de semilla a vaina (RSV),
floración (FL), días después de la floración para fructificación (DAFPF), días
después de la floración para cosecha fresca (DAFPCF) y la variable básica
rendimiento de grano por hectárea (PDG), evaluados en cultivares de frijol
común en un experimento realizado en la ciudad de Pombal - PB.
Initially, phenotypic and
genotypic correlations of the explanatory variables with the basic variable GY
showed the same sign and similar magnitude. The genotypic and environmental
correlations between PUP x GY, PD x GY and DAFOPF x GY, showed different signs.
Environmental correlations showed positive and negative values.
PUP, PL and PP showed high
phenotypic and genotypic correlation with GY, while NGP, SS and FL moderately
correlated with GY and TNP, PD, NPP and PSR weekly correlated with GY. Finally,
GY correlated weakly and negatively with DAFOPF and moderately and negatively
with DAFFH.
A high environmental
correlation was observed between POS and GY, moderate environmental
correlation of SS with GY and weak environmental correlation of TNP, PL, NGP,
NPP, PSR, FL and DAFPOF with GY, and of PUP, PD and DAFFH with GY.
Among the variables
showing high phenotypic correlation with GY, only PL and PP had direct
high-magnitude effects exceeding the residual effect estimate. Despite a high
correlation with GY, PUP had a direct effect, not exceeding the residual
effect. Among the variables that showed moderate phenotypic correlation with
GY, NGP had a direct negative effect on GY. SS and FL had a direct effect, not
exceeding the residual effect. Among the variables showing weak phenotypic
correlation with GY, TNP had a direct negative effect on the main variable,
while PD and NPP had a direct effect not exceeding the residual effect. Despite
a weak phenotypic correlation with the main variable, PSR showed a direct
effect exceeding the residual effect.
Regarding the genotypic path
analysis of the variables showing high correlation with GY, only PP had a
direct effect exceeding 2.5 times the residual effect. PUP had no direct
effect, and PL had a negative direct effect. NGP and SS had a direct effect not
surpassing the residual effect, while FL had a direct effect 1.5 times higher
than the residual effect. Among the variables with a weak correlation with the
main variable, TNP had no direct effect. PD and NPP had a direct negative
effect, and PSR showed a direct effect 2 times higher than the residual effect.
Among most variables,
considering the environmental trail analyses, the direct effects did not exceed
the magnitude of the residual effect. However, the direct effect of POS on GY,
exceeding twice the residual effect, was noteworthy.
Table 4 shows the direct and indirect effects of the secondary
components on the primary components of grain yield in cowpea beans based on
the causal diagram shown in Figure 1.
Table 4: Direct and indirect effects of six secondary components (SS, PP,
PSR, LFL, DAFFF and DAFFH) on six primary components (TNP, PUP, PL, PD, NGP and
NPP) of grain yield evaluated in cowpea cultivars in an experiment conducted in
the municipality of Pombal - PB.
Tabla 4: Efectos directos e indirectos de seis componentes secundarios
(PDC, PDV, RSV, LFL, DAFPF y DAFPCF) sobre seis componentes primarios (NTV,
MUV, COMPV, DIAMV, NGVA y NVPL) del rendimiento de grano evaluado en cultivares
de frijol caupí en un experimento realizado en la ciudad de Pombal - PB.
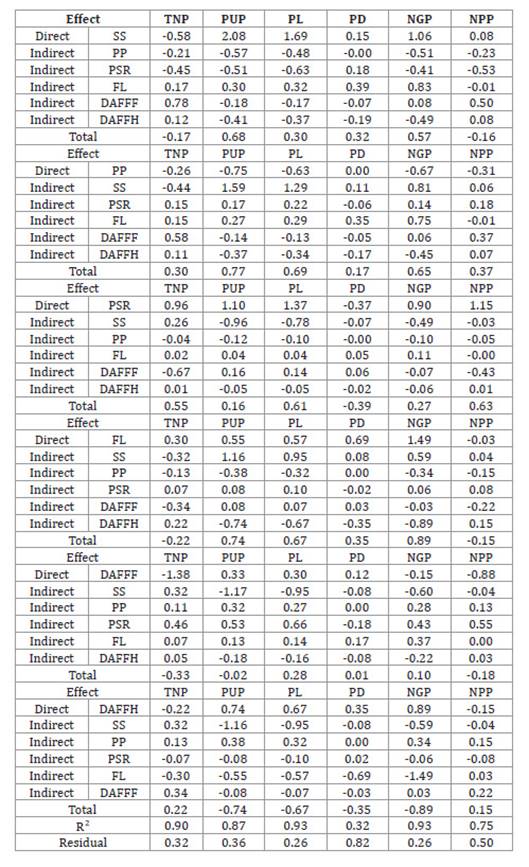
Once again, considering the
coefficient of determination, there was good precision in the regression
analysis. It appeared that the SS variable had a moderate correlation and a
high magnitude direct effect with PUP and NGP. The variable SS, despite a weak
correlation with PL, haD a direct high-magnitude effect exceeding the residual
effect.
The PSR variable had a
moderate correlation with TNP, PL and NPP and a high-magnitude direct effect,
and weak correlation with PUP and NGP, with a high-magnitude direct effect
outweighing the residual effect. The FL variable had a strong correlation with
PUP and NGP and a high-magnitude direct effect outweighing the residual effect,
and moderate correlation with PL, but with a direct effect exceeding the
residual.
Finally, DAFFH had a low
correlation with PUP, PL and NGP, but with direct high-magnitude effect
exceeding the residual effect.
Discussion
The existence of genetic
variability explains the significant differences between the variables
evaluated in cowpea cultivars (4). Specifically, this
variability is caused by different alleles and the phenotypic expression of
these variables under evaluation (13). For genetic improvement, this crucial result allows the
artificial selection of superior cultivars regarding these important production
components (46).
The calculated
coefficients of variation were heterogeneous. According to the classification
proposed by Gomes (20), values were low for PL,
PD, PSR, FL and DAFFH, average for NGP and DAFFF, and high for TNP, PUP, NPP,
GY, SS and POS. According to Marques Júnior et al. (1997),
the heterogeneity of the experimental material contributes to a higher
coefficient of variation. This heterogeneity would explain why experiments with
cowpea show higher estimates of the coefficient of variation than other
cultures. It should also be noted that many of these variables were previously
evaluated in other studies with coefficients of variation between similar
ranges (26, 41). Thus, our experimental
precision may be considered adequate (5, 45).
According to Dutra Filho et al. (2020), the phenotypic
expression of PL, NGP, PSR, FL, DAFFF and DAFFH is mostly due to genetic
effects since the genotypic variance exceeded the environmental variance. This
result points to a repetition in the phenotypic expression of these important
production components in the respective environment for selection of superior
cultivars.
The genotypic variation
coefficient (CVg) allows measuring genetic variability (40). Although the ANOVA had previously identified variability among
the variables, the CVg identifies those variables with the greatest genetic
variability for a breeder to practice selection and obtain greater gains.
According to Oliveira et. al. (2008),
CVg >10, is considered high; therefore, in the present work, NGP, NPP, GY,
SS, PP and DAFFF showed high potential for breeding strategies.
The ratio between the
genotypic coefficient of variation and the experimental coefficient of
variation (CVg/CVe) was greater than unity for PL, NGP, PSR, FL and DAFFH. This
genetic parameter, also called index b, identifies variables with greater
genetic variability and cultivar selection potential, guiding the most suitable
breeding method for the crop (6). In other words, the
greater the magnitude, the simpler methods with a high probability of
significant genetic gains. When index b shows heterogeneity in the variables
considered production components, applying different methods of selection
indices turns out important for maximizing genetic gains in each analyzed
variable.
Heritability coefficients
indicate high reliability of the phenotypic value as an indicator of genetic
value in NGP, NPP, GY, SS, PP, DAFFPF and DAFFH, considering the estimated
values were high > 75 (22). Heritability
coefficients for PD, NPP and SS showed medium magnitude. Thus, ample
possibilities for significant genetic gains can be inferred in cowpea selection
based on variables with high-magnitude heritability (38). Variables with medium magnitude coefficients may allow genetic
gains to a lesser extent.
Heritability corresponds
to the heritable proportion of the total genetic variability of the variables
under evaluation (7). High magnitude estimates
in the present work indicate the need to study correlations among these
characters, especially heritable genotypic correlations guiding an adequate
selection strategy (23). This procedure, with the
respective developments in path analysis, will allow defining the best
selection index model maximizing genetic gains through direct and indirect
selection and, thus, increasing farm productivity with new cultivars in the
hinterland of Paraíba.
Regarding the correlations,
according to Cruz et al. (2012), sampling errors
are the main cause of different signals in phenotypic and genotypic
correlations of a given variable. Phenotypic and genotypic correlations of
explanatory variables with GY presented in Table 3, with same sign and similar magnitude, demonstrate an
excellent experimental and analytic precision (18). When genotypic and environmental correlations show
different signs, such as PUP x GY, PD x GY and DAFOPF x GY, the causes of
genetic and environmental variations influence these variables by different
physiological mechanisms (1). In
environmental correlations, TNP x GY, SS x GY and POS x GY present the same
sign and are influenced by the same sources of environmental variations, while
different signs evidence how the environment favors one character over the
other (36).
As explained, the
correlation coefficient measures the association between two variables,
assuming that for high correlation and positive sign, a gain on one variable
can be obtained through indirect selection on the other (37). However, the type of strategy, whether direct or indirect
selection, should initially be designed by path analysis, carefully observing
the direct and indirect effects when a large number of variables is available.
The study is finally complemented by evaluating selection indices.
In the path analysis, the
variable PUP had a high phenotypic and genotypic correlation with the basic
variable GY, however, the direct effect is low and null (Table 3). This means that direct selection will not provide
significant genetic gains in the basic variable GY (41). In addition, PUP had a low magnitude heritability
coefficient (Table 2). The
recommended strategy would be simultaneous selection of characters with
emphasis on those with high indirect effects, such as POS (15). This emphasizes the importance of evaluating and
identifying suitable models of selection indexes.
The variable PL also
presented a high phenotypic and genotypic correlation with GY. However, in this
case, the direct effect is low in the phenotypic correlation and negative in
the genotypic correlation, given by the absence of cause and effect; i.e. pod
length is not the main determinant of GY. Therefore, our recommendation is to
identify other variables providing greater selection gain (11).
Regarding PP, high
phenotypic correlation with GY and a direct effect in favor of selection
defines an efficient indirect selection. This result is even more promising
when observing the genotypic correlation between PP and GY. In addition to
being a high genotypic correlation, and therefore heritable, the direct effect
has a high magnitude exceeding 2.5 times the residual effect. These variables
have a true cause-and-effect association. POS is the main determinant of GY,
and since this association is directly proportional (with a positive sign in
the correlation), it implies that cowpea selection with higher pod yield will
be an effective indirect selection of higher grain yield (39). It should also be noted that in the present work and due to its
high heritability, POS was classified as a secondary component of production.
For NGP, the simultaneous
selection strategy should pay special attention to the PP variable with
high-magnitude indirect effects (18).
The variables NPP, SS, FL
and DAFFH showed moderate phenotypic and genotypic correlation with GY. NPP did
not correlate with GY. Considering SS, simultaneous selection must be adopted,
and for FL, a direct selection strategy is the most suitable, i.e., the
shorter the flowering time, the earlier the harvest and consequent investment
return. The variable DAFFH presents an inversely proportional relationship of
cause and effect with GY, meaning early cycle cultivars allow higher
productivity and earlier harvests.
Variables showing weak
correlations obtained costly direct and indirect selection gains. Again, we
recommend selection index models verifying feasibility.
In the environmental path
analysis, the POS variable highly correlated with GY with a direct and
favorable effect. As this experiment was conducted under an irrigated system,
we could infer that both variables benefited from the same environmental
variations, in particular, fertilization, irrigation and pest control (9).
The path analysis of the
secondary components for each primary component demonstrated that for SS, the
direct selection strategy maximized selection gain for PUP and NGP.
The high and moderate
correlation of PP with PUP, PL and NGP was determined by the indirect effect
via SS. Thus, a good strategy in POS selection obtaining significant gains in
PUP, PL and NGP, should consider SS through simultaneous selection. Direct PSR
and FL selection strategy should maximize gains in TNP, PL and NPP, and in PUP,
PL and NGP, respectively.
After carefully approaching path
analysis of secondary components with primary components of production, no
easy-to-measure secondary morphological components of great importance could
determine the primary components of grain production (GY), with the exception
of FL and DAFFH. This difficulty has already been reported by other authors
working with bean crops (24). New correlations and path
analyses should consider other secondary components in the semi-arid region of
Paraíba.
Conclusions
Variables with greater
potential were identified for the selection of superior cultivars of cowpea in
the semiarid region of Paraíba.
The pod yield variable
(PP) seems promising for cultivar selection considering higher grain yield
(GY).
Direct and simultaneous
selection are the most suitable strategies.
Maximized genetic gains
call for further studies on selection indices.
Acknowledgments
To the National Council for
Scientific and Technological Development (CNPq) for granting the scientific
initiation scholarship (PIBIC).
1.
Almeida, R. D.; Peluzio, J. M.; Afferri, F. S. 2010. Phenotypic, genotypic and
environmental correlations in soybean cultivated under an irrigated meadow in
south of Tocantins state. Bioscience Journal. 26: 95-99.
2.
Alves, R.; Rocha, J.; Teodoro, L.; Carvalho, L.; Farias, F.; Resende, M.;
Bhering, L.; Teodoro, P. 2021. Path analysis under multiple-trait BLUP:
application in the study of interrelationships among traits related to cotton (Gossypium
hirsutum) fiber length. Revista de la Facultad de Ciencias Agrarias.
Universidad Nacional de Cuyo. Mendoza. Argentina. 53(1): 1-10.
3.
Beltrão, B. A.; Souza Júnior, L. C.; Morais, F.; Mendes, V. A.; Miranda, J. L.
F. 2005. Diagnosis of the municipality of Pombal. Project to register
underground water supply sources. Recife: Ministry of Mines and
Energy/CPRM/PRODEM. 23.
4.
Benvindo, R. N.; da Silva, J. A. L.; Freire Filho, F. R.; de Almeida, A. L. G.;
Oliveira, J. T. S.; Carvalho Bezerra, A. A. 2010. Evaluation of semi-prostrate
cowpea genotypes in rainfed and irrigated cultivation. Comunicata Scientiae. 1:
23-23.
5.
Bertasello, L. E. T.; Filla, V. A.; Prates Coelho, A.; Vitti Môro, G. 2021.
Agronomic performance of maize (Zea mays L.) genotypes under Azospirillum
brasilense application and mineral fertilization. Revista de la Facultad de
Ciencias Agrarias .
Universidad Nacional de Cuyo. Mendoza. Argentina. 53(1): 68-78.
6.
Blank, A. F.; Silva, T. B.; Matos, M. L.; Carvalho Filho, J. L.; Mann, R. S.
2013. Genotypic, phenotypic and environmental parameters for morphological and
agronomic characters in pumpkin. Horticultura Brasileira. 31: 106-111.
7.
Borém, A.; Miranda, G. V. 2013. 5° ed. Melhoramento de plantas. Viçosa. Ed.
UFV. 523 p.
8.
Carvalho, C. G. P. D.; Oliveira, V. R.; Cruz, C. D.; Casali, V. W. D. 1999.
Path analysis under multicollinearity in green pepper. Pesquisa Agropecuária
Brasileira. 34: 603-613.
9.
Coimbra, R. R.; Miranda, G. V.; Viana, J. M. S.; Cruz, C. D. 2015. Correlations
between characters in the popcorn population DFT1-Ribeirão/correlation among
characters in the popcorn population DFT-1 Ribeirão. Ceres. 48: 427- 435.
10.
Cruz, C. D. 2006. Programa Genes: estatística experimental e matrizes. Ed. UFV.
285 p.
11.
Cruz, C. D.; Regazzi, A. J.; Carneiro, P. C. S. 2012. 4° ed. Modelos
biométricos aplicados ao melhoramento genético. Ed. UFV 508 p.
12.
Dutra Filho, J. A.; Júnior, T. C.; Neto, D. E. S.; Souto, L. S.; Luna, R. G.;
Souza, A. S. 2020. Efficience of repetibility methods in final stages of the
sugarcane genetic breeding Research Society and Development. 10: 1-29.
13.
Dutra Filho, J. A.; Silva, F. S.; Souto, L. S.; Souza, A. D. S.; Luna, R. G.;
Moreira, G. R.; Júnior, T. C. 2021. Energy cane x sugarcane microregion
interaction in the State of Pernambuco: Sugarcane for production of bioenergy
and renewable fuels. Agronomy. 11: 21-22.
14.
Dutra Filho, J. A.; Souto, L. S.; de Luna, R. G.; Souza, A. dos S.; Silva, F.
G.; Silva, F. A. C.; Simões Neto, D. E.; Calsa Júnior, T. 2021. Mixed modeling
for fiber yield genetic selection in sugarcane (Saccharum officinarum). Revista de la Facultad de
Ciencias Agrarias .
Universidad Nacional de Cuyo. Mendoza. Argentina. 53(2): 11-19.
15.
Entringer, G. C.; Santos, P. H. A. D.; Vettorazzi, J. C. F.; Cunha, K. S. D.;
Pereira, M. G. 2014. Correlation and path analysis for yield components of
supersweet corn. Ceres. 61: 356-361.
16.
Falconer, D. S. 1987. Introdução à genética quantitativa. Ed. UFV. 279 p.
17.
Fernandes, V. L. B. 1993. Recomendações de adubação e calagem para o estado do
Ceará. Ed. UFC. 248 p.
18.
Ferreira, F. M.; Barros, W. S.; Silva, F. L. D.; Barbosa, M. H. P.; Cruz, C.
D.; Bastos, I. T. 2007. Phenotypic and genetic relationships among yield
components in sugarcane. Bragantia. 66: 605-610.
19.
Freitas, T. G. G.; Lima, P. S.; Vale, J. C.; Silva, Í. N.; Silva, E. M. 2019.
Grain yield and track analysis in the evaluation of traditional coawel bean
varieties. Caatinga. 32: 302-311.
20.
Gomes, F. G. 2009. 15° ed. Curso de estatística experimental. Ed. FEALQ. 451 p.
21.
Hoogerheide, E. S. S.; Vencovsky, R.; Farias, F. J. C.; Freire, E. C.; Arantes,
E. M. 2007. Correlations and technological character trail analysis and cotton
fiber productivity. Pesquisa agropecuária Brasileira. 42: 1401-1405.
22.
Jost, E.; Ribeiro, N. D.; Maziero, S. M.; Cerutti, T.; Rosa, D. P. 2009.
Genetic effects of calcium content in beans. Ciência Rural. 39: 31-37.
23. Kang, M. S.; Tai, P.; Miller, J. 1991. Genetic and phenotypic
path analyses in sugarcane: artificially created relationships. Crop Science.
31: 1684-1686.
24.
Kurek, A.; Carvalho, F.; Assmann, I.; Machioro, V.; Cruz, P. 2001. Path
analysis as an indirect selection criterion for bean grain yield. Rev.
Brasileira de agrociência. 7: 29-32.
25.
Li, C. C. 1975. Path analysis-a primer. Ed. Pacific grove. 346 p.
26.
Lopes, Â. C. D. A.; Freire Filho, F. R.; Silva, R. B. Q. D.; Campos, F. L.;
Rocha, M. D. M. 2001. Variability and correlations between agronomic traits in
cowpea (Vigna unguiculata). Pesquisa
agropecuária Brasileira .
36: 515-520.
27.
Marques Júnior, O. G.; Ramalho, M. A. P.; Mendonça, H. A. D.; Santos, J. B. D.
1997. Effect of adjacent plots on the evaluation of some characters in common
bean cultivars Bragantia. 56: 199-206.
28.
Montgomery, D. C.; Peck, E. A. G. V. 1981. 5° ed. Introduction to linear
regression analysis. Ed. New York. 504 p.
29.
Moura, E. M.; Righetto, A. M.; Lima, R. R. M. 2011. Assessment of water
availability and demand on the Piranhas-Açu river stretch between
Coremas-Mother D’água Weirs and Armando Ribeiro Gonçalves. Revista Brasileira
de recursos hídricos. 16: 07-19.
30.
Nascimento, H. T. S.; Filho, F. R. F.; Rocha, M. M.; Ribeiro, V. Q.; Damasceno,
K. J. S. 2009. Production, advances and challenges for the cultivation of
cowpea in Brazil. Actas VII National Congress of Cowpea beans, 2. National
meeting of cowpea beans. Annals 7. 2009. 1, Belém - PA.
31.
Nogueira, A. P. O.; Sediyama, T.; Sousa, L. B.; Hamawaki, O. T.; Cruz, C. D.;
Pereira, D. G. 2012. Path analysis and correlations among traits in soybean grown
in two dates sowing. Bioscience
Journal . 28: 877-888.
32.
Oliveira, A. P.; Araújo, J. S.; Alves, E. U.; Noronha, M. A.; Cassimiro, C. M.;
Mendonça, F. G. 2001. Yield of cowpea cultivated with cattle manure and mineral
fertilizer. Horticultura Brasileira. 19: 81-84.
33.
Oliveira, A. P. D.; Sobrinho, J. T.; Nascimento, J. T.; Alves, A. U.;
Albuquerque, I. C. D.; Bruno, G. B. 2002. Evaluation of cowpea lines and
cultivars in Areia, PB. Rev. Horticultura Brasileira. 20: 180-182.
34.
Oliveira, R. A.; Daros, E.; Bespalho, K.; Filho, J. C.; Zambon, J. L. C.; Ido,
O. T.; Weber, H.; Hugo, Z. E. N. I. 2008. Selection of sugarcane families via
mixed models. Scientia Agraria. 9: 269-274.
35.
Oliveira, O. M. S. D.; Silva, J. F. D.; Ferreira, F. M.; Klehm, C. D. S.;
Borges, C. V. 2013. Genotypic associations between yield components and
agronomic traits in cowpea. Ciência Agronômica. 44: 851-857.
36.
Pípolo, V. C.; Takahashi, H. W.; Endo, R. M.; Petek, M. R.; Seifert, A. L.
2002. Correlation among quantitative traits in popcorn maize. Horticultura
Brasileira. 20: 551-554.
37.
Ribeiro, N. D.; Mello, R.; Costa, R. D; Sluszz, T. 2001. Genetic correlations
of agromorphological characters and their implications for the selection of
carioca bean genotypes. Current agricultural science and technology. 7: 93-99.
38.
Rocha, M. D. M.; Carvalho, K. J. M. D.; Filho, F. R. F.; Lopes, Â. C. D. A.;
Gomes, R. L. F.; Sousa, I. D. S. 2009. Genetic control of peduncle length in
cowpea. Pesquisa agropecuária Brasileira . 44: 270-275.
39.
Salla, V. P.; Danner, M. A.; Citadin, I.; Sasso, S. A. Z.; Donazzolo, J.; Gil,
B. V. 2015. Path analysis in jabuticaba fruit characters. Pesquisa agropecuária Brasileira . 50: 218-223.
40.
Santos, F. W.; Florsheim, S. M. B.; Lima, I. D.; Tung, W. S. C.; Silva, J. M.;
Freitas, M. L. M.; Sebbenn, A. M. 2008. Genetic variation for basic wood
density and silvicultural characters in a base population of Eucalyptus
camaldulensis Dehnh. Revista do Instituto Florestal. 20: 185-194.
41.
Santos, A.; Ceccon, G.; Correa, A. M.; Durante, L. G. Y.; Regis, J. A. V. B.
2012. Genetic and performance analysis of cowpea genotypes cultivated in the
cerrado-swampland transition. Revista cultivando o saber. 5: 87-102.
42.
Santos, A. D.; Ceccon, G.; Davide, L. M. C.; Correa, A. M.; Alves, V. B. 2014.
Correlations and path analysis of yield components in cowpea. Rev. crop breeding and applied biotechnology. 14: 82-87.
43.
Souza, L. S. B. D.; Moura, M. S. B. D.; Sediyama, G. C.; Silva, T. G. F. D.
2011. Water use efficiency of corn and cowpea crops under exclusive and
intercropped planting systems in the Brazilian semiarid region. Bragantia. 70:
715-721.
44.
Souza, R. F. 2010. Phosphorus dynamics in soils influenced by liming and
organic fertilization, cultivated with common bean. Thesis doctorate in soils
and plant nutrition. Federal University of Lavras. MG. 141 p.
45.
Tavares de Albuquerque, J. R.; Anizio Lins, H.; Galdino dos Santos, M.; Moreira
de Freitas, M. A.; Sarmento de Oliveira, F.; Evangelista de Souza, A. R.;
Silveira, L. M.; de Sousa Nunes, G. H.; Barros Júnior, A. P.; de Melo Jorge
Vieira, P. F. 2022. Influence of genotype-environment interaction on soybean (Glycine
max L.) genetic divergence under semiarid conditions. Revista de la Facultad de
Ciencias Agrarias. Universidad Nacional de Cuyo. Mendoza. Argentina. 54(1):
1-12.
46.
Teixeira, I. R.; Silva, G. C. D.; Oliveira, J. P. R. D.; Silva, A. G. D.; Pelá,
A. 2010. Agronomic performance and seed quality of cowpea cultivars in the
cerrado region. Ciência Agronômica. 41: 300-307.
47.
Williams-Alanís, H.; Aranda, U.; Árcos Cavazos, G.; Zavala Garcia, F.; Galicia
Júarez, M.; Rodríguez Vázquez, M. del C.; Elizondo Barrón, J. 2022. Line x
tester analysis to estimate combining ability in grain sorghum (Sorghum
bicolor L.). Revista
de la Facultad de Ciencias Agrarias. Universidad Nacional de Cuyo. Mendoza.
Argentina. 54(2): 12-21.
48.
Wright, S. 1921. Correlation and causation. Journal of agricultural research.
20: 557-585.
49.
Wright, S. 1923. The theory of path coefficients: a replay to Niles’ criticism.
Genetics. 8: 239-255.