Revista de la Facultad de Ciencias
Agrarias. Universidad Nacional de Cuyo. Tomo 54(2). ISSN (en línea) 1853-8665.
Año 2022.
Original article
Interference
and threshold level of Sida rhombifolia in transgenic soybean cultivars
Interferencia y nivel de daño económico de Sida
rhombifolia en cultivares de soja transgénica
Alessandro Konzen 1
Maico André Michelon
Bagnara 1
Leonardo Brunetto 1
Ignacio Aspiazú 2
Antônio Marcos Loureiro da
Silva 1
Daiane Brandler 3
Hugo Von Linsingen Piazzetta
1
André Luiz Radünz 4
Gismael Francisco Perin 1
1 Federal University of Fronteira Sul. Campus Erechim. Laboratory
of Sustainable Management of Agricultural Systems. 99700-970.
Erechim. Rio Grande do Sul. Brazil.
2 State
University of Montes Claros. Department of Agricultural
Sciences. 39440-000. Janaúba. Minas Gerais.
Brazil.
3 Federal University of Technology Paraná. Campus Pato Branco. Laboratory
of Weed Science Research Centre. 85503- 390. Pato Branco. Paraná. Brazil.
4 Federal
University of Fronteira Sul. Campus Chapecó. Department of Agronomy.
89815-899. Chapecó. Santa Catarina. Brazil.
Abstract
This study
aimed to assess the interference and threshold level (TL) of Sida
rhombifolia, the arrowleaf sida, competing with different soybean
cultivars. The treatments comprised different soybean cultivars (NS 6909, NA
5909, DM 5958, Brasmax ELITE, Brasmax LANÇA, and SYN 13561) and densities of
arrowleaf sida plants per square meter (m-2)
(0, 2, 3, 4, 9, 15, 16, 23, 22, and 58; 0, 2, 3, 3, 6, 6, 10, 11, 18, and 47;
0, 3, 4, 7, 8, 10, 11, 13, 15, and 24; 0, 1, 4, 6, 12, 18, 19, 31, 44, and 50;
0, 4, 5, 6, 9, 13, 17, 20, 20, and 47; 0, 2, 3, 5, 9, 11, 15, 18, 29, and 30,
respectively) for each cultivar. Cultivars NS 6909, NA 5909, and Brasmax Lança
were more competitive than DM 5958, Brasmax Elite, and SYN 13561. The TL values
varied from 0.55 to 0.95 plants m-2 for cultivars NS 6909, NA
5909, and Brasmax Lança, which exhibited greater competitiveness with arrowleaf
sida. The lowest values of TL varied from 0.26 to 0.61 plants m-2 for cultivars DM 5958, Brasmax
Elite, and SYN 13561, which had less competitiveness with weed.
Keywords: Glycine max; Arrowleaf sida; Integrated weed
management.
Resumen
El objetivo de este estudio fue evaluar la interferencia y determinar el
nivel de daño económico (NDE) de escoba dura infestando diferentes cultivares
de soja. Los tratamientos fueron cultivares de soja (NS 6909, NA 5909, DM 5958,
Brasmax ELITE, Brasmax LANÇA y SYN 13561) y las densidades de escoba dura (0,
2, 3, 4, 9, 15, 16, 23, 22 y 58; 0, 2, 3, 3, 6, 6, 10, 11, 18 y 47; 0, 3, 4, 7,
8, 10, 11, 13, 15 y 24; 0, 1, 4, 6, 12, 18, 19, 31, 44 y 50; 0, 4, 5, 6, 9, 13,
17, 20, 20 y 47; e 0, 2, 3, 5, 9, 11, 15, 18, 29 y 30 plantas m-2),
respectivamente, para cada cultivar. Los cultivares NS 6909, NA 5909 y Brasmax
Lança son más competitivos que DM 5958, Brasmax Elite y SYN 13561. Los valores
de NDE varían de 0,55 a 0,95 plantas m-2 para los cultivares NS 6909,
NA 5909 y Brasmax Lança, que mostraron mejor competitividad. Los valores más
bajos de NDE varían de 0,26 a 0,61 plantas m-2 para los cultivares DM 5958,
Brasmax Elite y SYN 13561, los cuales mostraron menor competitividad con la
maleza.
Palabras
clave: Glycine max; Escoba dura; Manejo integrado de
malezas.
Originales: Recepción: 06/10/2021
Aceptación:
07/11/2022
Introduction
Knowledge and
management of factors that lead to reduced crop yield is essential for farmers
to obtain better productive results considering the importance of soybeans in
Brazil. Weeds can cause significant losses if not properly managed. Competition
losses can vary from 2-94% depending on factors such as soybean cultivars, weed
densities and species, emergence times, and edaphoclimatic conditions (14, 19,
29, 32).
In general,
weeds compete with crops for environmental resources such as water, light, and
nutrients and can cause high losses in soybean yield when left uncontrolled (13, 14,
17 22, 23, 32). Among the
weeds that cause losses in soybean crops, Sida rhombifolia, the
arrowleaf sida, stands out mainly because of its adaptability to low fertility,
acidic soils, and high competitive ability (12). In addition, it has amphistomatic leaves
with anomocytic stomata that can readily adapt to the environment where they
grow and develop (11). Therefore,
the correct management of arrowleaf sida is essential in soybean crops because
its occurrence causes direct (such as reduced grain yield) and indirect losses
(such as virus transmission to many crops by being the hosts of silverleaf
whitefly) (23).
According to Agostinetto et al. (2010) and Zandoná
et al. (2018), in addition to understanding the damage caused by
competition, it is necessary to understand the influence of weed density and
distribution when they coexist with crops in a given field. Owing to the
efficiency, practicality, and low cost of herbicides, these are used as general
management strategies for weeds compared with other control methods (31). Despite the advantages of chemical control,
the search for more sustainable production models is a priority in the current
discussions on grain production based on threshold level (TL) strategies for
weed management. Thus, TL is an essential tool for farmers, allowing crop
monitoring and decision making about the most appropriate time and way to
manage weeds.
The TL concept
recommends that applying herbicides or other control methods is justified only
when the damage caused by weeds is more than the cost of control measures (1, 21). High densities of weeds competing with
crops render decision-making by producers easier as adopting control measures
with low population densities of weeds becomes difficult owing to the
quantification of economic advantages associated with the control costs (21).
Mathematical
models have been used to estimate the loss of grain yield owing to the presence
of weeds (18). The
hyperbolic relationship between grain yield and weed population was first
described by Cousens (1985), wherein an empirical
rectangular hyperbola model was adjusted to predict yield loss as a function of
weed population demonstrating its superiority over the other models. The
rectangular hyperbola model is based on the non-linear relationship between the
percentage of yield loss due to interference in competition-free control and
weed population (10). It
incorporates parameter i, which represents the loss of production caused
by adding the first weed, and parameter a, which symbolizes the loss of
crop production as weed density approaches infinity. The biological significance
of the model demonstrates that the competition effect of each weed added to the
crop decreases as weed density increases owing to intraspecific competition.
Initially, yield loss is proportional, but the loss decreases above a
particular weed density.
We hypothesized
that there would be differences in the competitive abilities of the crop and TL
because of soybean cultivars coexisting with increasing densities of arrowleaf
sida. Therefore, the objective of this study was to evaluate the interference and
TL of arrowleaf sida competing with different soybean cultivars.
Material
and methods
Site
The
experiment was conducted under field conditions in an experimental area of the
Federal University of Fronteira Sul, Campus Erechim/RS/BR, with geographic
coordinates of 27°43’47” S and 52°17’37” W, from October 2017 to February 2018.
The soil is classified as humic aluminoferric red latosol at an altitude of 670
m above sea level (15).
The local climate is Cfa, i.e., a humid temperate climate having hot summers,
wherein rains are distributed well throughout the year, based on the
classification established by Köppen (Figure 1) (8, 20).
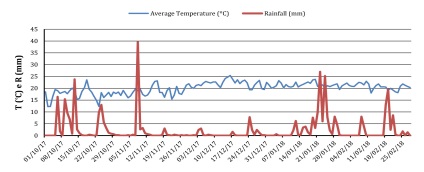
Source: Inmet (2018).
Fuente:
Inmet (2018).
Figure 1: Rainfall and
average daily temperature during the soybean crop cycle from October 2017 to
February 2018, UFFS, Erechim/RS.
Figura 1: Precipitación y temperatura media diaria
durante el ciclo del cultivo de la soja de octubre de 2017 a febrero de 2018,
UFFS, Erechim / RS.
The pH
correction and fertilization in the soil were performed based on
physicochemical analysis following the technical recommendations for soybean
crops (26). The
physicochemical characteristics of the soil were: pH = 5.1; Organic matter =
3.0%; P = 5.2 mg dm-3;
K = 118 mg dm-3;
Al 3+
= 0.3 cmolc dm-3;
Ca2+
= 5.5 cmolc dm-3;
Mg2+
= 3.0 cmolc dm-3;
cation exchange capacity (CEC) = 7.4 cmolc dm-3;
CEC at pH7= 16.6 cmolc
dm-3;
H + Al = 7.7 cmolc dm-3;
sum of bases = 53%, and clay content = 60%. The no-tillage system was employed,
and vegetation was dried using glyphosate herbicide at a concentration of 1440
g ae ha-1, 20 d before
sowing soybean cultivars with a sowing-fertilizing machine on October 4th
2017, distributing 480 kg ha-1 based on the formula NPK
02-20-20 in sowing furrow.
Experimental
design
The
experimental design was completely randomized, with four replicates, and the
treatments were composed of six soybean cultivars, i.e., NS 6909 IPRO, NA 5909
RG IPRO, DM 5958 RSF, Brasmax Elite IPRO, Brasmax Lança IPRO, and SYN 13561
IPRO, and ten densities of arrowleaf sida for each cultivar (0, 2, 3, 4, 9, 15,
16, 23, 22, and 58 plants m-2;
0, 2, 3, 3, 6, 6, 10, 11, 18, and 47 plants m-2;
0, 3, 4, 7, 8, 10, 11, 13, 15, and 24 plants m-2;
0, 1, 4, 6, 12, 18, 19, 31, 44, and 50 plants m-2;
0, 4, 5, 6, 9, 13, 17, 20, 20, and 47 plants m-2;
and 0, 2, 3, 5, 9, 11, 15, 18, 29, and 30 plants m-2).
As the arrowleaf sida weed originated from the soil seed bank, the
establishment of densities varied with factors such as competition for
resources, vigor, and humidity, which prevented the exact number of plants per
area of experimental unit from being established. The different densities of
arrowleaf sida acted as replicates, providing the necessary variation for the
statistical analysis performed using the nonlinear model proposed by Cousens (1985) and Agostinetto et
al. (2010).
Plot
management
Each
experimental unit consisted of a 15 m2 area (5 m × 3 m) having six
soybean lines spaced 0.50 m apart with four central lines considered
appropriate evaluation areas and discounting 1 m of front and end borders of
each plot. The sowing density of different soybean cultivars was 14 viable
seeds per meter, corresponding to a density of 280,000 seeds ha-1,
i.e., 28 plants m-2.
Soybean cultivars were selected based on their characteristics of undetermined
growth and genetic differences. These are also the most cultivated soybean
varieties in Rio Grande do Sul. All six cultivars bear resistance to insects
and tolerance to herbicides but differ in crop cycles and maturation groups. NA
5909 RG IPRO and Brasmax Elite IPRO have early crop cycles, SYN 13561 IPRO has
an early to medium cycle, and NS 6909 IPRO, DM 5958 RSF IPRO, and Brasmax Lança
IPRO possess medium cycles. In addition, the cultivars NA 5909 RG IPRO, Brasmax
Elite IPRO, SYN 13561 IPRO, NS 6909 IPRO, DM 5958 RSF IPRO, and Brasmax Lança
IPRO belong to maturation groups 6.2, 5.5, 6.1, 6.3, 5.8, and 5.8,
respectively.
We applied
glyphosate herbicide at a concentration of 1440 g ha-1 to the soil to reduce the
density of competing weed species as the crop reached V3 to V4 phenological
stages 40 d after emergence (DAE), and the weed was at the two-four leaves
stage. We selected the season because of its suitability for applying
herbicides post the emergence of genetically modified soybeans. The arrowleaf
plants were protected using plastic cups and buckets to prevent herbicide
damage. The application was performed using a precision CO2-pressurized
backpack sprayer equipped with four DG 110.02 spray tips, maintaining a
constant pressure of 210 kPa and a travel speed of 3.6 km ha-1,
which provided a herbicide spray flow of 150 L ha-1.
Evaluated
variables and sampling
The
quantification of the plant density (PD), leaf area (LA), soil cover (SC), and
dry mass (DM) of the shoots of arrowleaf sida was performed 54 d after crop
emergence.The number of plants present within two plots with an area of 0.25 m2
(0.5 m × 0.5 m) per plot was counted to determine PD. SC was
evaluated visually by two individual evaluators, using a percentage scale on
which a score of zero corresponded to the absence of cover, and a score of 100
represented the total SC. A portable LA meter model, CI-203 BioScence, was used
to determine the LA (cm2 m-2)
by collecting the plants in the center of each experimental unit in an area of
0.25 m2
(0.5 m × 0.5 m). To determine DM after measuring LA, arrowleaf
sida plants were placed in kraft paper bags and dried in a forced-air
circulation oven at 72°C until no further weight change occurred.
At the end of
the soybean cycle, the grain yields of cultivars were determined by harvesting
plants in an area of 6 m2 (3 m × 2 m) for each
experimental unit as the moisture content of grains reached approximately 15%.
We determined the moisture content of grains by weighing them and correcting
the obtained grain mass for a moisture content of 13%,
which were then extrapolated for kg ha-1.
The soybean cultivars were harvested 130 d after sowing.
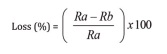
The percentage losses in the
grain yield of soybean cultivars concerning experimental units free of
competing plants were calculated using Equation 1:
 (1)
(1)
where
Ra and Rb = the crop yields with
and without the presence of the competing arrowleaf sida plants, respectively.
The values of
DM (g m-2), SC (%), and
LA (cm2) were multiplied
by 100 before data analysis to eliminate the use of correction factors in the
model (1, 29).
Statistical
analysis
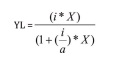
We
determined the association between the percentages of grain yield loss and
explanatory variables separately for each soybean cultivar using a nonlinear
regression model derived from rectangular hyperbola proposed by Cousens (1985) according to Equation 2:
 (2)
(2)
where
YL = yield loss
(%)
X = PD, LA, SC
and DM of arrowleaf sida.
i and a = the yield
losses (%) per unit of the arrowleaf plant as the values of the variables
approach zero and infinity, respectively.
Data adjustment
for PD, SC, LA, and DM variables was performed using the Proc Nlin procedure of
SAS to estimate the competitive ability and TL of the species using the
mathematical modeling procedure (27). We used the Gauss-Newton method for
estimating the values of parameters wherein the sum of the squares of
deviations in observations for the adjusted values is minimized by successive
iterations (1). The F-statistic
value (p ≤ 0.05) was used as the criterion for fitting the model to the
data. The acceptance criterion for matching the model to the data was based on
the highest coefficients of determination (R2)
and F values, and the lowest mean of squared residuals (MSR).
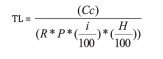
Parameter
estimates obtained from the equation proposed by Cousens
(1985) and adapted from Lindquist and Kropff (1996)
were used to calculate the level of economic damage, i.e., TL (Equation
3).
 (3)
(3)
where
TL = the
threshold level (plants m-2)
Cc = the control
cost of herbicide and tractor application (dollars ha-1)
R = the grain
yield of soybean cultivars (kg ha-1)
P = soybean price
(dollars kg-1 of grains)
i = yield loss (%) of soybean
per unit of the competing plant as population level approaches zero
H = herbicide
efficiency (%).
We
estimated three values for variables Cc, R, P, and H (Equation 3).
For Cc, we considered the average cost of tractor application, and the maximum
and minimum costs were changed by 25% of this average cost. R was estimated
based on the lowest, highest, and average yields obtained in Rio Grande do Sul
over the last ten years (9). The soybean price P was
estimated based on the lowest, highest, and average cost of soybeans paid per
60 kg bag in the last ten years (7). The values of H were
established as 80, 90, and 100% of control, with 80% being the minimum weed
control considered effective (27). For TL simulations,
intermediate values were used for the uncalculated variables.
Results
and discussion
Competitive
ability of soybean cultivars with arrowleaf sida
The explanatory
variables PD, LA, SC, and shoot DM of arrowleaf sida for all soybean cultivars
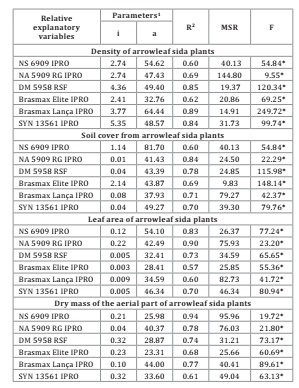
exhibited significant F values (Table 1).
Table
1: Rectangular hyperbola
model adjustments obtained for loss of grain yield, as a function of plant
density, soil cover, leaf area, and dry mass arrowleaf sida (Sida
rhombifolia) and soybeans cultivars.
Tabla 1: Ajustes del modelo de hipérbola rectangular obtenidos
por pérdida de rendimiento de granos, en función de la densidad de plantación,
la cobertura del suelo, el área foliar y la masa seca de los cultivares de
afata (Sida rhombifolia) y cultivares de soja.
1 i
and a:
losses in productivity (%) per arrowleaf sida unity when the value of the
variable approaches zero and infinity, respectively, obtained by the
rectangular hyperbolic model Y= (i.X)/(1+(i/a).
X (Cousens, 1985). *: Significant at p ≤ 0.05. R2:
Determination coeficient. MSR: average square of
residue.
1 i y a: pérdidas de productividad (%) por
unidad de afata cuando el valor de la variable se aproxima a cero o tiende a
infinito, obtenido por el modelo de hipérbola rectangular Y= (i.X)/ (1+(i/a).X (Cousens, 1985); respectivamente * Significativo a p
≤ 0,05 R2:
Coeficiente de determinación MSR: Cuadrado medio del residuo.
The
rectangular hyperbola model showed adjustments for all evaluated cultivars,
with R2
higher than 0.57 and low MSR values. Variations in data
adjustment were observed in relation to the cultivar and studied variables,
corroborated by results observed in literature for the rice competing with
barnyardgrass (1), beans competing with
alexandergrass (21),
and soybeans competing with alexandergrass (19).
Cargnelutti Filho and Storck (2007) considered the
values of R2 between 0.57 to 0.66 as
moderate to good when working with the genetic variation, effect of cultivars,
and heritability of corn hybrids, which partly agree with the results observed
in this study.
The results
revealed that the estimated values for parameter i tended to be higher
for soybean cultivars DM 5958 RSF, Brasmax Elite IPRO, and SYN 13561 IPRO
compared with the average values of all evaluated variables, i.e., PD, SC, LA,
and DM (Table 1). Additionally, the cultivars
NS 6909 IPRO, NA 5909 RG IPRO, and Brasmax Lança IPRO were verified to be
highly competitive, presenting lower grain yield losses compared to other
cultivars, with lower average values of i. These competitive differences
may be related to genetic differences present in the cultivars determining
characteristics such as crop cycle, maturation group, height, LA index, root
system, and ramifications through which plants defend themselves during a
shortage of resources, i.e., light, water, and nutrients in the environment.
These results are consistent with those reported by Butts et
al. (2018), who evaluated the competition of Amaranthus tuberculatus
with soybeans, and observed a 35% reduction in shoot biomass when the crop
was put into competition with different densities of three biotypes of the weed
species. The study also reported the number of arrowleaf sida required to cause
more than 20% losses in soybean grain yield. We discovered that the loss was
already evident in seven plants m-2 for cultivar SYN 13561 IPRO
(21.15%) and in eight plants m-2 for DM 5958 RSF IPRO (20.44%)
and Brasmax Lança IPRO (20.54%).
The other
cultivars tested in the presence of these numbers per square meter exhibited
below 18.7% loss in yield (Table 1). Similarly, Galon et al. (2019) assessed soybean yield loss
demonstrating the differential tolerance of the crop as the cultivars SYN 1059
IPRO, BMX Elite IPRO, and NS 5445 IPRO lost a lower percentage of grains than
the cultivars NS 5959 RG IPRO and SYN 13561 IPRO when competing with different
alexandergrass densities. Thus, the specific capacity of cultivars to
coexist and tolerate the presence of various weed species, i.e., arrowleaf sida
or alexandergrass, is evident based on the intrinsic characteristics of each
cultivar.
The results
revealed that as arrowleaf sida doubled the size of its LA, increasing from 250
cm2
m-2 to 500 cm2 m-2,
the cultivars NS 6909 IPRO, NA 5909 RG IPRO, DM 5958 RSF, Brasmax Elite IPRO,
Brasmax Lança IPRO, and SYN 13561 IPRO lost 32.3%, 21.8%, 48.3%, 50.0%, 46.9%,
and 48.7% of grain yield, respectively (Table 1). Because the loss in grain yield resulted from the
failure of soybean to fully shade the soil until 54 DAE, allowing more light
penetration through the community canopy, rendering the crop less competitive
than arrowleaf sida plants.
When a crop is
shaded, competition for solar radiation increases, making the resource search
less efficient. Consequently, it is less able to develop and grow, thus
decreasing grain yield (25). Similar results were observed by Galon et al. (2019), who tested different soybean
cultivars in competition with alexandergrass densities and found that increases
in the LA of the weed increased yield loss. The yield loss results of the
soybean cultivars in relation to the SC percentage were similar to those
observed for PD and LA, that is, an increase in the SC percentage of the
arrowleaf plants increased crop damage (Table 1). All soybean cultivars exhibited a high percentage
reduction in grain yield with increased weed SC. This is consistent with the
explanation for PD and LA because the plant that exhibits higher values obtains
the advantage of competition over its neighbor, primarily due to light
resources. Consequently, it shows more intense growth and development, as
previously discussed.
Studies on Digitaria
ciliaris, Echinochloa crus-galli var. crus-galli, Bidens pilosa,
Euphorbia heterophylla, Urochloa plantaginea, and Sida
rhombifolia demonstrate the high competitiveness of these species with
soybeans (2, 4, 19, 21, 25). The incidence of sunlight owing to low SC
can stimulate the emergence of weeds. However, there was no increase in
germination in the presence of light for arrowleaf sida because it is
insensitive to this condition (16), which allows the species to establish under
a wide range of environmental conditions, and thus compete with the crops.
Accumulating
100 g m-2
of DM, arrowleaf sida decreased the grain yield of cultivars NS
6909 IPRO, DM 5958 RSF, Brasmax Elite IPRO, and SYN 13561 IPRO by more than
11%, and that of NA 5909 RG IPRO and Brasmax Lança IPRO by less than 4%. (Table 1).
Additionally, the same authors mentioned that cultivars with high stature,
rapid emergence, and greater accumulation of biomass in shoots are more
competitive. Bean cultivars competing with alexandergrass (21) exhibited different competitive behaviors,
which are probably related to their different intrinsic characteristics, such
as growth habit, development cycle, number of branches, and volume of the root
system, which affect the competitive ability of the crop and cause
differentiation between the cultivars competing with weeds.
The parameter i
is an index used to compare the relative competitiveness of species (1). Different i values were observed for
the soybean cultivars for the tested explanatory variables (Table 1). Other studies have also compared the competitiveness of
corn cultivars (3), soybeans (18), rice (18), beans (21), and wheat (30). The comparison
between the soybean cultivars in terms of explanatory variables (PD, LA, SC,
and DM) showed that the order of competitiveness was NA 5909 RG IPRO > NS
6909 IPRO > Brasmax Lança IPRO > DM 5958 RSF > Brasmax Elite IPRO >
SYN 13561 IPRO (Table 1).
The differences between the results are primarily due to different genetic
characteristics or the occurrence of a high standard error in the estimation of
i, which can be attributed to variability associated with field
experimentation (1). Other studies
reported similar results when verifying that rice cultivars competing with rice
grass (1), beans (21), or soy (19) responded differently in terms of the evaluated parameters
when infested with weeds.
For all
explanatory variables, cultivars from the same growth cycle or maturation group
had different i-values (Table 1). This demonstrates that
soybean cultivars respond differently to competition with arrowleaf sida,
primarily because of the morphophysiological characteristics of the cultivars,
which define their ability to compete with weeds for environmental resources (3). Another explanation is related to the different statures
of the cultivars, important in the competition for light, affecting yield,
depending on the stage at which shading occurs in relation to the definition of
the yield components (25). According to
these authors, shaded leaves receive less intense and reflected light, which
causes a gradual decrease in photosynthetic rate as they approach the ground.
The estimates
of a, regardless of the explanatory variable, were all less than 100% (Table 1), demonstrating that it was possible to adequately
simulate the maximum losses in soybean grain yield with different densities of
arrowleaf sida. If crops have high productive potential and adequate conditions
for soil fertility, water availability, and luminosity, a lower daily
percentage loss will be caused by certain species of weeds (21).
The comparison
between the evaluated explanatory variables for all soybean cultivars
demonstrated a better fit of the model in the order PD > LA > SC > DM,
considering the highest mean values of R2 and F and the lowest mean
values of MSR (Table 1), indicating that PD can be
used to replace the other variables to estimate soybean grain yield losses.
To simulate the
TL values, the PD of the arrowleaf sida was used, as it exhibited the best fit
for the rectangular hyperbola model. It is the most commonly used variable in
experiments with this objective owing to its ease, speed, and low cost (1, 19, 21).
Economic
damage level of arrowleaf sida in soybean
The successful
implementation of management systems for arrowleaf sida in soybean fields can
be achieved by determining the density that exceeds TL. We observed that the
cultivars NS 6909, NA 5909 RG IPRO, and Brasmax Elite IPRO had the highest TL
values in all performed simulations, ranging 0.50-0.95 plants m-2 (Figure 2 and Figure 3).
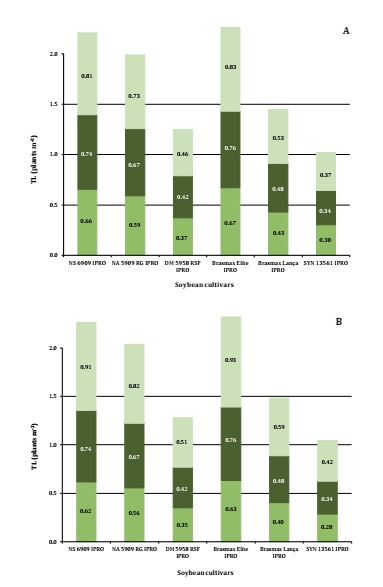
Figure 2: Threshold level
(TL) of arrowleaf sida (Sida rhombifolia) as a function of soybean grain
yield (A) and price of cultivars (B). UFFS, Erechim-RS, 2018.
Figura 2: Nivel de daño económico (TL) de escoba dura (Sida
rhombifolia) en función del rendimiento de granos (A) y del precio (B) de
soja cultivares. UFFS,
Erechim-RS, 2018.
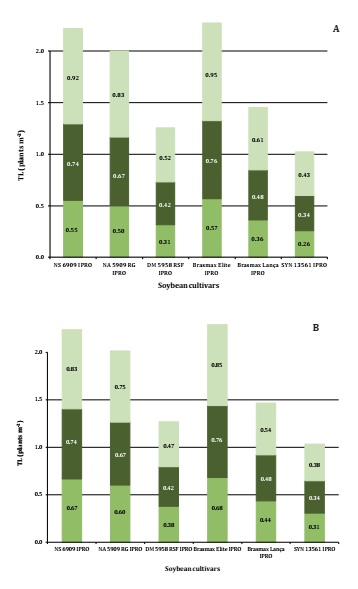
Figure 3: Threshold level
(TL) of arrowleaf sida, Sida rhombifolia, as a function of control cost
(A) and herbicide efficiency (B) and soybean cultivars. UFFS, Erechim-RS, 2017/18.
Figura 3: Nivel de daño económico (TL) de escoba dura (Sida
rhombifolia) en función del costo de control (A) y de la eficiencia de los
herbicidas (B) y de cultivares. UFFS, Erechim-RS, 2017/18.
The lowest TL
values were obtained for cultivars DM 5958 RSF, Brasmax Elite IPRO, and SYN
13561 IPRO, ranging 0.26-0.61 plants m-2.
This is probably due to the lower initial growth speed or because they are very
productive cultivars, and thus, are more sensitive to competition with weeds,
even at low densities. According to Balbinot Jr. and Fleck
(2005), cultivars that present a high growth rate at the beginning of the
cycle and appropriate plant characteristics, especially stature, suffer less
competition with weeds. Galon et al. (2019) also
observed that soybean cultivars that presented the highest grain yields suffered
the most competition with alexandergrass, that is, the lowest number of plants
m-2
was necessary to reach the TL.
In the
average of all soybean cultivars, there was a difference in TL of approximately
24% when comparing the lowest with the highest grain yields (Figure 2A). Therefore, the higher the
productive potential of the cultivars, the lower the density of arrowleaf
plants required to overcome TL, making the adoption of
control measures worthwhile. When evaluating the TL for alexandergrass
infesting bean (21) and soybean (19) cultivars, it was observed that it varied depending on the
evaluated cultivars, and those with the greatest productive potential
demonstrated a smaller TL.
The average
results for all soybean cultivars with the highest versus the lowest price paid
per bag exhibited 1.47 times higher variation in TL (Figure 2B). Therefore, the lower the price paid per bag of soybeans,
the higher the population of arrowleaf sida needed to overcome TL, thus
compensating for the control method. Tavares et al.
(2019) and Galon et al. (2019) reported
similar results concerning the price paid per bag of wheat and soybean,
respectively, corroborating the findings of this study.
The minimum
cost for the average arrowleaf sida cost to control in all cultivars was 40.14%
lower when compared with the maximum cost. Thus, the higher the cost of the
control method, the higher the TL and the more arrowleaf sida plants per square
meter needed to justify the control measures (Figure 3A). The use of TL as a tool for weed management is only
justified in farms that use good agricultural practices for soybean management,
such as crop rotation, proper plant arrangement, use of more competitive
cultivars, adequate sowing times, and correct soil fertilization.
For the
efficiency of chemical control with herbicides, there were changes in the TL of
12.28 and 11.76% when comparing the average efficiency (90%) with the lowest
(80%) and the highest (100%), respectively (Figure 3B). Therefore, the control level influences TL, and the more efficient the herbicide, the lower the TL
(the smaller the number of arrowleaf sida per square meter necessary to adopt
the control measures). This was also verified by Agostinetto
et al. (2010) and Galon et al. (2019),
who applied herbicides to control barnyard grass and alexander grass in irrigated
rice and soybean crops, respectively. Song et al.
(2017) obtained TL of five common weed species assuming a 90% efficiency of
the herbicide for the studied region of 0.70 plants m-2 as a threshold to control them
in a soybean field, which corroborates with the results of this study.
Although the
soybean cultivars differed from each other, the TL values indicated that the
control was justified in low weed populations, even in situations where the
soybean bag value was the lowest, exhibiting the high competitive capacity of
this weed and the need to manage it to avoid losses. Konzen
et al. (2021) reported that arrowleaf sida, when competing with
soybean cultivars, reduced the dry mass and leaf area of crop plants, with
interspecific competition being more harmful than intraspecific competition.
Considering the
average soybean yield of 2,760 kg ha-1 for the last 10 years in the
state of Rio Grande do Sul (9), an average price of $18.87 per 60 kg bag,
and arrowleaf sida Cc of $17.07 ha-1,
we estimated that these costs were equivalent to 1.96% of production costs. The
presence of 1 plant m-2 arrowleaf sida caused yield
losses of 2.36%, 2.59%, 4.00%, 2.24%, 3.56%, and 4.85% in soybean cultivars NS
6909 IPRO, NA 5909 RG IPRO, DM 5958 RSF, Brasmax Elite IPRO, Brasmax Lança
IPRO, and SYN 13561 IPRO, respectively, (Table 1), and all cultivars exhibited losses higher than the
control cost. These results indicate that arrowleaf sida are very competitive,
even in low populations, and control measures that eliminate up to 99% of the
infestation may not be sufficient to avoid losses in soybean grain yield.
When prices of
agricultural products are high compared to the usual prices, the adoption of
weed control measures with 100% effectiveness becomes important. Thus, even if
only a few weeds remain in a given area, they will cause remarkable economic
losses considering the product value, and small grain yield losses will result
in a significant decrease in profits. Any stress can potentially be
economically harmful.
Conclusions
The nonlinear
regression model of the rectangular hyperbola adequately estimated the grain
yield losses of NS 6909 IPRO, NA 5909 RG IPRO, DM 5958 RSF, Brasmax Elite IPRO,
Brasmax Lança IPRO, and SYN 13561 IPRO soybeans in the presence of increasing
arrowleaf sida densities and exhibited the best fit for the variable density of
the arrowleaf sida plants. The soybean cultivars NS 6909 IPRO, NA 5909 RG IPRO,
and Brasmax Lança IPRO were more competitive than DM 5958 RSF, Brasmax Elite
IPRO, and SYN 13561 IPRO considering the explanatory variables (PD, LA, SC, and
DM). The TL values varied from 0.55 to 0.95 plants m-2 for cultivars NS 6909 IPRO, NA
5909 RG IPRO, and Brasmax Lança IPRO, which proved to be more competitive with
arrowleaf sida. The lowest TL values ranged 0.26-0.61 plants m-2 for the cultivars DM 5958 RSF,
Brasmax Elite IPRO, and SYN 13561 IPRO, which had less competitive potential
with weeds. The TL values decreased with an increase in grain yield and price
of soybeans, a reduction in the cost of controlling arrowleaf sida, and
herbicide efficiency, which justifies the adoption of control measures at lower
weed densities.
Acknowledgements
We thank CNPq,
FAPERGS, FINEp, and UFFS for their financial support for research and for
granting scholarships.
1. Agostinetto, D.; Galon, L.; Silva, J. M. B. V.; Tironi, S. P.;
Andres, A. 2010. Interference and economic weed threshold (Ewt) of
barnyardgrass on rice as a function of crop plant arrangement. Planta Daninha.
28: 993-1003.
2. Agostinetto, D.; Fontana, L. C.; Vargas, L.; Markus, C.;
Oliveira, E. 2013. Relative competitive ability of crabgrass
in coexistence with flooded rice and soybean. Pesquisa Agropecuária
Brasileira. 48: 1315-1322.
3. Balbinot Júnior, A. A.; Fleck, N. G. 2005. Competitivity between weeds and two corn (Zea mays)
genotypes grown under different row widths. Planta Daninha . 23: 415-421.
4. Bastiani, M. O.; Lamego, F. P.; Agostinetto, D.; Langaro, A.
C.; Silva, D. C. 2016. Relative competitiveness of soybean
cultivars with barnyardgrass. Bragantia. 75:
435-455.
5. Butts, T.; Vieira, B.; Latorre, D.; Werle, R.; Kruger, G. 2018.
Competitividade do water hemp resistente a herbicida (Amaranthus
tuberculatus) com soja. Weed Science. 66: 729-737.
6. Cargnelutti Filho, A.; Storck, L. 2007. Evaluation statistics of the experimental precision in corn
cultivar trials. Pesquisa Agropecuária Brasileira. 42: 17-24.
7. Centro de Estudos Avançados em Economia Aplicada (CEPEA). 2021.
Departamento de Economia, Administração e Sociologia,
ESALQ - Escola Superior de Agricultura Luiz de Queiroz, USP - Universidade de
São Paulo, Piracicaba, SP. https://cepea.esalq.usp.br/soja
(fecha de consulta: 10/09/2021).
8. Centro Estadual de Meteorologia (CEMETRS). 2012. Porto
Alegre/RS. https://www.agricultura.rs.gov.br/centro-estadual-de-meteorologia-e-revitalizado-594d163f275a5 (fecha de consulta: 03/09/2021).
9. Companhia Nacional de Abastecimento (CONAB). 2019. Acompanhamento de safra brasileira de grãos: décimo segundo
levantamento. https://www.conab.gov.br/info-agro/safras/graos (fecha de consulta: 13/09/2021).
10. Cousens, R. 1985. An empirical model
relating crop yield to weed and crop density and a statistical comparison with
other models. Journal of Agricultural Science.
105: 513-521.
11. Cunha, V. C.; Santos, J. B.; Ferreira, E. A.; Cabral, C. M.;
Silva, D. V.; Gandini, E. M. 2012. Comparative leaf anatomy
of guanxuma species. Planta Daninha .
30: 341-349.
12. Cunha, V. C.; Santos, J. B.; Guimarães, C. G.; Ribeiro, K. G.;
Miranda, R. R. S.; Silva, D. V.; Concenço, G. 2014. Leaf area
and epicuticular wax content of Sida spp. Revista Ceres. 61: 172-177.
13. da Costa Zonetti, P.; Dotto, G.; de Carvalho, T. F. F.; de
Souza Bido, G.; Carvalho Gomes Corrêa, R.; Paiola Albrecht, L.; Paiola
Albrecht, A. J. 2022. Effect of forage aqueous extracts on Glycine
max L. Merr., Zea mays L. and Bidens pilosa L. Revista de la
Facultad de Ciencias Agrarias. Universidad Nacional de
Cuyo. Mendoza. Argentina. 54(1): 70-76
14. Diesel, F.; Trezzi, M. M.; Gallon, M.; Mizerski, P. H. F.;
Batistel, S. C.; Pagnoncelli, F. B. 2020. Interference of
broadleaf buttonweed and white-eye in soybean. Planta Daninha . 38: e020186466.
15. Empresa Brasileira de Pesquisa Agropecuária (EMBRAPA). 2013.
Brazilian system of soil classification. Sistema brasileiro de
classificação de solos. Brasília: Embrapa Solos. 154 p.
16. Fleck, N. G.; Agostinetto, D.; Vidal, R. A.; Merotto Júnior,
A. 2001. Effects of light and nitrogen sources on germination
of Bidens pilosa and Sida rhombifolia seeds. Ciência e Agrotecnologia. 25: 592-600.
17. Forte, T. C.; Basso, F. J. M.; Galon, L.; Agazzi, L. R.;
Nonemacher, F.; Concenço, G. 2017. Competitive ability of transgenic
soybean cultivars coexisting with weeds. Revista
Brasileira de Ciências Agrárias. 12: 185-193.
18. Galon, L.; Agostinetto, D. 2009. Comparison of empirical
models for predicting yield loss of irrigated rice (Oryza sativa) mixed
with Echinochloa spp. Crop Protection. 28: 825-830.
19. Galon, L.; Oliveira Rossetto, E. R.; Fransceschetti, M. B.;
Bagnara, M. A. M.; Bianchessi, F.; Menegat, A. D.; Brunetto, L.; Silva, A. M.
L.; Gallina, A.; Basso, F. J. M.; Winter, F.; Perin, G. F.; Forte, C. T. 2019.
Interference and economic threshold level of alexander grass in soybean as a
function of cultivars and weed populations. International
Journal of Advanced Engineering Research and Science. 6: 74-81.
20. Instituto Nacional de Meteorologia (INMET). 2021. http://www.inmet.gov.br/portal/index.php?r=tempo2/mapasPrecipitacao> (fecha
de consulta: 10/09/2021).
21. Kalsing, A.; Vidal, R. A. 2013. Critical density of alexander
grass in common bean. Planta Daninha .
31: 843-850.
22. Koehler-Cole, K.; Proctor, C. A.; Elmore, R. W.; Wedin, D. A.
2021. Spring-planted cover crops for weed control in soybean. Renewable Agriculture and Food Systems. 36: 501-508.
23. Konzen, A.; Galon, L.;
Weirich, S. N.; Gallina, A.; Brunetto, L.; Brandler, D.; Piazetta, H. V. L.; A.
Aspiazú, I. 2021. Competitive interaction between soybean
cultivars and Sida rhombifolia. Revista Brasileira de Ciências Agrárias, 16: e8975.
24. Lindquist, J. L.; Kropff, M. J. 1996. Application of an
ecophysiological model for irrigated rice (Oryza sativa) - Echinochloa
competition. Weed Science. 44: 52-56.
25. Merotto, J. R. A.; Fischer, A. J.; Vidal, R. A. 2009. Perspectives for using light quality knowledge as an advanced
ecophysiological weed management tool. Planta Daninha , 27: 407-419.
26. Rede Oficial de Análise de Solo e de Tecido
Vegetal (Rolas). 2016. Fertilization and liming manual for the states of Rio Grande
do Sul and Santa Catarina. 10th ed. Porto Alegre, RS, SBCS.
376 p.
27. SAS (Institute Statistical Analysis System). 1989. User’s
guide: version 6.4 ed. Cary: SAS Institute. 846 p.
28. Sociedade Brasileira da Ciência das Plantas Daninhas (SBCPD). 1995.
Procedures for installation, evaluation and analysis of experiments with
herbicides. Londrina: SBCPD. p. 42.
29. Song, J.; Kim, J. W.; Im, J. H.; Lee, K.; Lee, B.; Kim, D.
2017. The effects of single- and multiple-weed interference on soybean yield in
the far-eastern region of Russia. Weed Science. 65: 371-380.
30. Tavares, L. C.; Lemes, E. S.; Ruchel, Q.; Westendorff, N. R.
2019. Agostinetto, D. Criteria for decision making and
economic threshold level for wild radish in wheat crop. Planta Daninha . 37: e019178898.
31. Timossi, P. C.; Freitas, T. T. 2011. Efficacy of nicosulfuron
isolated and associated with atrazine on the weeds management of corn. Revista Brasileira de Herbicidas. 10: 210-218.
32. Zandona, R. R.; Agostinetto, D.; Silva, B. M.; Ruchel, Q.;
Fraga, D. S. 2018. Interference periods in soybean crop as affected by
emergence times of weeds. Planta Daninha .
36: e018169361.
Declaration of competing interest
The authors
declare that they have no conflict of interest.
Financial
support.
The authors are grateful to the National Council for Scientific and
Technological Development (CNPq) for financial support (process number
406221/2016-2) and for the fellowship (process number 306927/2019-5).