Revista de la Facultad de Ciencias
Agrarias. Universidad Nacional de Cuyo. Tomo 54(2). ISSN (en línea) 1853-8665.
Año 2022.
Original article
Spatial
pattern of mottled stripe disease (Herbaspirillum rubrisubalbicans) in
sugar cane
Patrón espacial del moteado clorótico (Herbaspirillum
rubrisubalbicans) de la caña de azúcar
Rosalba Quiñones-Valdez 1
Hilda Victoria Silva-Rojas ²
Alvaro Castañeda-Vildozola 1
Omar Franco-Mora 1
Apolonio Valdez-Balero 3
1 Programa de Postgrado en Ciencias Agropecuarias y
Recursos Naturales. Facultad de Ciencias Agrícolas. Campus Universitario “El
Cerrillo” Piedras Blancas. Toluca. Estado de México. CP 50200. México
2 Laboratorio de Biotecnología y Patología de semillas del
Colegio de Postgraduados. Km 36,5 carretera México
Texcoco Montecillo. Estado de México. CP 56230. México.
3 Colegio
de Postgraduados Campus Tabasco. Periférico S/N Heroica Cárdenas. Tabasco.
CP 86500. México.
Abstract
Sugar cane (Saccharum
spp. hybrids) is the most important agroindustrial crop of the tropics.
Recently, sugar cane plants with chlorotic leaf streaking associated with the
bacterium Herbaspirillum rubrisubalbicans have been observed. This
disease impacts photosynthetic capacity and yield. Characterizing the
spatio-temporal behavior of chlorotic mottling using prediction maps is an
important element of integrated disease management. Here, we determine the
spatial distribution of mottled stripe disease in sugar cane in southeastern
Mexico. To do this, we randomly chose and georeferenced 80 points in commercial
plots in 2016 and 2017 to determine the disease incidence. We generated an
experimental semivariogram based on a predetermined theoretical model and
estimated Kriging. The incidence was 2.93% in 2016 and 5.36% in 2017 in
varieties ICP-MEX-92-1420, CP-72-2086, ITV-92-373, MEX-79434 and MEX-69-290.
The spatial behavior of the bacteria fit the pentaspherical model in 2016 and
the spherical model in 2017. Spatial interpolation was validated by Mean Error
(ME), Root Mean Square Error (RMSE) and Mean Standardized Prediction Error
(MSPE) values near zero, visualized using the generated map. The results will
be used to guide management of mottled stripe disease in sugar cane in the affected
area.
Keywords: Bacteria; Incidence; Spatio-temporal
distribution; Saccharum spp.
Resumen
La caña de azúcar (Saccharum spp. híbridos) es el cultivo
agroindustrial más importante de regiones tropicales. Recientemente, en sus
hojas se han observado estrías cloróticas asociadas con la bacteria Herbaspirillum
rubrisubalbicans que afecta la capacidad fotosintética de la planta y su
rendimiento. El comportamiento espacio temporal es un elemento importante para
el manejo integral de las enfermedades. Con el objetivo de determinar la
distribución espacial del moteado clorótico en caña de azúcar en el sureste de
México, se georreferenciaron 80 puntos en forma aleatoria en 2016 y 2017, para
determinar la incidencia de la enfermedad. Se generó un semivariograma
experimental ajustado a un modelo teórico preestablecido y se estimó el
Kriging. La incidencia de la enfermedad fue de 2,93% (2016) y 5,36% (2017) en
las variedades ICP-MEX-92-1420, CP-72-2086, ITV-92-373, MEX-79434 y MEX-69-290.
El comportamiento espacial se ajustó al modelo Penta-esférico en 2016 y
Esférico en 2017. La interpolación espacial se validó con valores cercanos a cero
de la Media del Error (ME), Raíz del Error Cuadrático Medio (RMSE) y Media
Estandarizada del Error de predicción (MSPE), visualizándose en el mapa
obtenido. Los resultados permitirán direccionar el manejo integral del moteado
clorótico en caña de azúcar en la zona afectada.
Palabras
clave: Bacteria; Incidencia; Distribución
espacio-temporal; Saccharum spp.
Originales: Recepción: 20/10/2021
Aceptación:
06/12/2022
Introduction
Sugar cane has
a high capacity for biomass production because it efficiently converts energy
into carbohydrates and stores sucrose in its stalk (26). Sugar cane is easy to produce, contributes
food for both livestock and humans, and is an important industrial input (14, 30). Mexico is the sixth largest producer of
sugar cane worldwide, contributing about 3.5% of total sugar cane production,
and about 48% of the sugar cane produced in Mexico is from the southeastern
region of the country, with an average yield of 74 t ha-1
(33). Like any monoculture, sugar
cane production is affected by phytosanitary problems that decrease yield,
juice purity, and the industrial quality of the product. Control measures
include using more tolerant varieties and thermally or chemically disinfecting
seeds (15). Despite these
measures, there has been a persistent increase in the incidence of diseases,
especially mottled stripe disease.
Mottled stripe
disease (also known as “chlorotic spotting”) causes the appearance of chlorotic
spots over the surface of the leaf blade, which join together to form lines or
streaks. Over time, the streaks change color to red-orange and eventually cover
the entire leaf, reducing the plant’s photosynthetic capacity (34). The causal organism of mottled stripe
disease is Herbaspirillum rubrisubalbicans (=Pseudomonas
rubrisubalbicans), which was first isolated from diseased sugar cane leaves
by Hale and Wilke (1972). Baldani
et al. (1996) later confirmed that H. rubrisubalbicans is an
endophytic diazotroph that colonizes the roots, stalks, and especially leaves
of sugar cane plants (Saccharum spp. Hybrids), leading to chlorotic
spotting.
Chlorotic
spotting is currently found in 30 countries, mainly in Africa and the Americas (5, 33). Given the diversity of varieties cultivated
in different regions, some sugar cane genotypes are apparently more susceptible
to the disease, which is mostly expressed in young plants (5). In Mexico, chlorotic spotting is considered
a re-emerging disease; it was first reported in the country in 1996 in some
sugar cane, maize, and sorghum plots (5). Initially, no crop damage was reported, but
chlorotic spotting currently leads to considerable losses in southeastern
Mexico (34).
More information on the location
of the disease and the ability to predict its occurrence over time is necessary
to prevent future infections. Geostatistics and geographical information
systems have been used as tools in integrated disease management. These tools
can help determine the spatial and temporal distribution of a pathogen or
insect pest, estimate the percentage of infection or infestation, and make
decisions on specific control measures to reduce costs (9, 31).
Maps of the spatial distribution and percentages of infection/infestation can
also be used to guide control measures to reduce contaminating particles and
economic losses (9, 23).
Spatial
modeling and digital mapping use computational algorithms and predictors that
represent the variables to map (11, 24). In addition to their use in the management
of diseases from a site-specific perspective, these models have research
applications in biology, the potential impacts of climate change, epidemiology,
biogeography, and geographic regions that require study (25). In recent years, understanding the spatial
distribution of diseases within the production area has been considered
essential for efficient disease management. This contributes to the development
of a sustainable production system by focusing on control options that decrease
damage, reduce costs, and yield a high-quality product (12). In this
study, we aimed to determine the spatial patterns of incidence of mottled
stripe disease in sugar cane in southeastern Mexico.
Materials and methods
The study area
included the commercial sugar cane production area between the coordinates
18°23’55” North and 95°46’47” West in the gulf region of southeastern Mexico.
In the years 2016 and 2017, we sampled plants with symptoms of mottled stripe
disease ten months after harvest (plant crop, first stubble crop or second
stubble crop). For each sampling, we considered 80 points that were randomly
generated by the program QGis. Each point was located in the study area using a
Global Positioning System (model Garmin-GPSmap USA) and georeferenced in the
field. At each point, the percent incidence of mottled stripe was determined
over 10 linear m using the formula: % I = ΣPA/ΣPT · 100,
where: % I is the percent incidence of disease symptoms, PA is
the number of plants with symptoms of mottled stripe, and PT is the
total number of plants sampled along 10 linear m from the georeferenced point.
Chemical control measures were not applied in any of the plots sampled. Monthly
minimum and maximum temperature and precipitation were obtained from the
Mexican agencies (8) for the
2015-2016 and 2016-2017 growing seasons.
Leaves
exhibiting typical chlorotic mottling symptoms were collected at each point to
determine the causal agent using molecular testing at the Seed Pathology
Laboratory at the College of Postgraduates, Montecillo Campus in Texcoco,
Mexico State. The sampled leaves were disinfected externally with a 1% (v/v)
sodium hypochlorite solution for 1 min, rinsed three times with sterile
distilled water, then placed on absorbent paper to
remove excess moisture. Leaf tissue sections measuring 0.5 × 0.5 mm were
transferred to Petri dishes containing King’s B medium then incubated at 28°C
for 48 h. Whitish-colored colonies developed, which were then cultured to
obtain pure cultures. Bacterial isolates underwent molecular characterization
using DNA extracted from the pure cultures of each isolate under the
cetyltrimethylammonium bromide (2%) buffer (CTAB) protocol (13). The DNA was quantified by spectrophotometry
in a Nanodrop 2000 (Thermo Scientific, USA) and considered to have adequate
quality for PCR analyses when the A260/280 and
A260/230 ratios
were between 1.8 and 2.2.
The 16S
rDNA was amplified via PCR using the universal primers 8F (5-AGAGTTTGATCCTGGCTCAG-3’)
and 1492R (5´-GGTTACCTTGTTACGACTT-3’). The PCR reactions were carried out in a
total volume of 15 μL containing 100 ng DNA, 0.8 mM of dNTP, 0.3 U of Go Taq
DNA polymerase (Invitrogen Carlsbad, CA, USA), 5x Go Taq reaction
buffer (Promega, Fitchburg, WI, USA), and 10 pmol of each primer. The PCR
parameters were as follows: single preheating step at 95°C for 2 min; 35 cycles
of 95°C for 2 min, 59°C for 1 min, and 72°C for 1.5 min; and a final extension
at 72°C for 5 min (26). All PCR reactions were
done in a DNA Engine thermal cycler (BioRad, CA, USA),
and the PCR products were verified by loading 5 μL into a 1.5% agarose gel in
1x Tris Acetate-EDTA buffer electrophoresed at 111 Volts for 1 h. The amplicons
were visualized using an Infinity-3026 WL/LC/ 26MX transilluminator (Vilber
Lourmat, Germany). The remaining volume of PCR product was cleaned with the
Exosap-IT enzyme protocol (Affymetrix, USA) following the manufacturer’s
instructions. To ensure that there were no misreadings, the PCR products were
sequenced in both directions with primers 514F (5’- GTGCCAGCMGCCGCGG-3’) and
800R (CTACCAGGGTATCTAAT-3) in a genetic analyzer (Applied Biosystems, CA, USA),
using a Big Dye Terminator V.3.1 Cycle Sequencing kit standard (Applied
Biosystem, CA, USA).
The sequences
corresponding to both strands of the 16S rDNA were assembled and edited using
BioEdit v7.0.5 (19), generating a
consensus sequence of each isolate. Since the basic local alignment search tool
from NCBI finds regions of local similarity between sequences with significant
alignments, the consensus sequences of each isolate were submitted to BLASTN
2.10.0 (3). Sequences
obtained in this study were deposited in the GenBank database.
The
geostatistical analysis of the incidence data consisted of estimating a
semivariogram and the parameters of the model as well as generating maps using
Kriging interpolation. The incidence data were transformed prior to analysis
using the inverse-logarithm to homogenize variance. The experimental
semivariogram value was calculated based on the equations established by Goovaerts (1999) and Isaaks and
Srivastava (1989):
![]()
where
y*(h) = the experimental value of the semivariogram for the
distance interval h;
N(h) = the number of pairs of samples separated by distance interval h;
z(xᵢ) = the value of the variable of interest at the sampling point xᵢ;
z(xᵢ+h) = the value of interest at the sampling point xᵢ+h.
The
experimental semivariogram was fit to a predetermined theoretical
semivariogram. The degree of spatial dependence was calculated to determine the
relationships among the data. The experimental semivariogram and the values
from the theoretical model were obtained using the program R (7, 29), using the gstat library (24).
Seven
theoretical models (spherical, exponential, gaussian, linear, matern, bessel, and pentaspherical) were tested to select the one
that best fit the experimental semivariogram of disease incidence. The best
model was the one with the lowest error (9, 10)
based on the following formula:
![]()
where
m = the lag
number (points separated by a given distance);
ỹ = the
semivariance values for each distance; y is the semivariance values from
the prediction model;
wi
= the semivariance factors obtained from the equation: wi=N/
ỹ 2
where
N = the number of pairs of points used to calculate ỹ for
each distance (9, 10).
Kriging (27) was then done using the
model with the lowest error. Three types of kriging were evaluated (simple,
ordinary, and universal) using the cross-validation technique. For
interpolation, the kriging with the lowest precision error was selected based
on the lowest mean error (11); root mean square error (1, 23, 35) and mean standardized
prediction error (11), which should all have
values close to zero. The result of kriging was a spatial layer in Geotiff
format generated using the rgdal package for R. Finally, the map was edited
using the program Surfer 15 (Surface Mapping System, Golden Software Inc. 809,
14th Street Golden, CO, 804011866, USA) to visualize the spatial
pattern of H. rubrisubalbicans.
Results
The
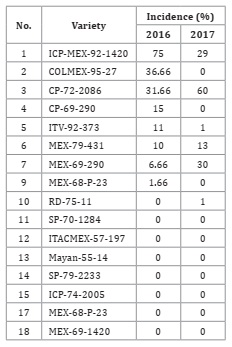
average incidence of chlorotic mottling symptoms was 2.93% in the 2016 season
and 5.36% in 2017 (Table 1).
Table 1: Incidence of mottled stripe (Herbaspirillum rubrisubalbicans)
in different varieties of sugar cane in commercial plots in southeastern Mexico
in the 2016 and 2017 seasons.
Tabla 1: Incidencia del moteado clorótico (Herbaspirillum
rubrisubalbicans) en diferentes variedades de caña de azúcar de parcelas
comeciales del sureste de México durante los ciclos 2016 y 2017.
Molecular characterization (5, 34)
confirmed that the bacterium Herbaspirillum rubrisubalbicans was present
in all the samples tested.
The mean
maximum temperature was 30°C, the mean annual temperature was 23.5°C, and mean
annual precipitation was 127.8 mm in 2016, while in 2017 the mean annual
precipitation was 144.3 mm and the mean annual temperature was 23.2°C (Figure 1) (8).
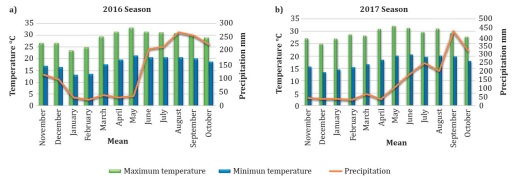
Figure 1: Precipitation
(right axis) and minimum and maximum monthly temperatures (left axis) from
November 2015 through October 2016 (2016 season; a) and from November 2016
through October 2017 (2017 season; b), in southeastern Mexico.
Figura 1: Precipitación y temperaturas máximas y
mínimas mensuales durante el ciclo de noviembre de 2015 a octubre de 2016 (a) y
de noviembre de 2016 a octubre 2017 (b) en el sureste de México.
Higher
precipitation and temperature were associated with a higher percent incidence
of mottled stripe in 2017.
The overall incidence of mottled stripe increased by 2.7% from
2016 to 2017. The ICP-MEX-92-1420 variety had the highest percent incidence,
followed by COLMEX-95-27 and CP-72-2086, which had the largest affected area.
The CP-72-2086 variety was the most preferred by producers and had the largest
cultivation area in the region. In 2017, the mottled stripe incidence in this
genotype doubled. The COLMEX-9527 variety had the second highest incidence in
2016, and in the MEX 69-290 variety, the incidence quadrupled from 2016 to 2017
(Table
1).
The
geostatistical analysis showed that the disease had an aggregate distribution
in both years of the study. The pentaspherical model was the model that best
fit the data on disease incidence in 2016 (Figure 1a), while in 2017 (Figure 1b) the incidence data were better described by the spherical
model. This shows a pattern of behavior with strongly defined points in both
years. In 2016, the disease was expressed in more of the varieties but at a
lower percent incidence. In 2017, fewer of the varieties were affected by the
bacteria, but there was an increase in the percent incidence; in other words,
the disease was apparently more aggressive.
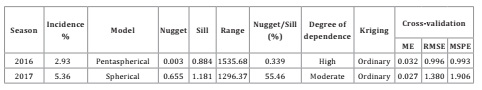
In the
semivariogram for 2016, there was spatial autocorrelation of the presence of
mottled stripe in the sugar cane crop at distances up to 1535.68 m (range),
beyond which the correlation among points decreased. This suggests that future
sampling should consider this distance between points for regional-level
studies. In addition, there was high degree of spatial dependence. In 2017, the
range of correlation was 1296.37 m, with moderate spatial structure or degree
of spatial dependence (Table 2).
Table
2: Incidence and parameters
from the fitted semivariogram models based on sampling of mottled stripe
disease in sugar cane (Herbaspirillum rubrisubalbicans) in commercial
plots in southeastern Mexico during the 2016 and 2017 growing seasons.
Tabla 2: Incidencia y parámetros de los
semivariogramas ajustados a modelos del moteado clorótico de la caña de azúcar
(Herbaspirillum rubrisubalbicans) en plantaciones comerciales del
sureste de México, durante los ciclos 2016 y 2017.
The maps of
the presence of the disease in southeastern Mexico and its pattern of behavior
(Figure 2) indicate that in 2016 the
bacterium was distributed in practically the entire region, except for the
northeast, while in 2017 the disease was less dispersed, with a more focused
presence in the southeast and northeast of the map of the study region.
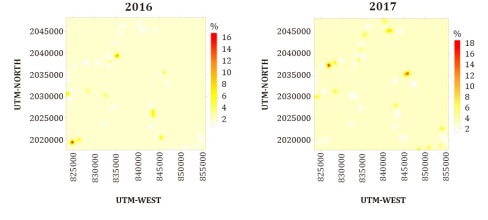
Figure 2: Spatial distribution maps
of incidence of symptoms of mottled stripe caused by Herbaspirillum
rubrisubalbicans in southeastern Mexico in 2016 (a) and 2017 (b).
Figura 2: Mapas de la distribución espacial de la
incidencia del moteado clorótico causada por Herbaspirillum rubrisubalbicans
en el sureste de México durante 2016 (a) y 2017 (b).
In 2016, the bacterium was found
from the central zone through the southern part of the sugar cane region, while
in 2017 it was distributed in the northeastern region of the study area.
Discussion
The bacterium H.
rubrisubalbicans was present throughout the study region and during both years of the study (2016-2017), indicating that this
pathogen can persist from one growing season to the next and spread from one
plot to another by different mechanisms (2). It was also
apparently well adapted to the climatic conditions in this sugar cane producing
region, as well as the ICP-MEX-92-1420, CP-72-2086, ITV-92-373, MEX-79-434, and
MEX-69-290 genotypes, which had the highest incidence of mottled stripe during
both years of the study. The average temperature was similar between the two
years of the study, but there was higher average annual precipitation in 2017,
which was associated with a higher percent incidence of the bacterium H.
rubrisubalbicans. In other words, when precipitation increased there was
increased spread of the bacteria.
The spatial
patterns expressed by diseases of bacterial origin can be influenced by a
variety of factors, including climate, soil characteristics, and progression of
the epidemic throughout the zone (22), as well as sampling protocols (6). Patterns of bacterial infection may also be
influenced by host susceptibility (17). This is consistent with findings of
different spatial patterns among different varieties of sugar cane that have
different levels of susceptibility by Belan et al. (2018)
and in the 2017 season in this study. The differences in spatial patterns
between the 2016 and 2017 seasons show the dispersion potential of the disease
in this crop system, as well as a latent infestation in the area, which means
that the disease may be expressed whenever more susceptible genotypes are
planted (6). In addition,
the increase in incidence could have been due to means of dispersal such as the
sowing or propagation of infected stalks, working with contaminated equipment
or tools, or growing more susceptible cultivars or genotypes that are less
tolerant to the pathogen.
Though we lack
concrete data on the economic losses cause by the bacterium, it is evident that
the leaf lesions affect the photosynthetic capacity and development of the plant.
(5) indicate that the strain NCPPB 1027 (= LMG 2286) of H.
rubrisubalbicans is considered a mild plant pathogen, which is found in
sugar cane crops and only affects susceptible cultivars. However, our results
show that the incidence, and thus potential damage to production, increases
substantially from one cycle to the next, reducing the quality of sugar cane
production in this region.
The
semivariograms and maps show aggregate behavior of this disease, expressed as
different spatial patterns given by the spatial dependence among points and the
severity of the effects in each plot. In this sense, Contreras-Rendón
et al. (2014) report spatially aggregated behavior of the bacterium Candidatus
Liberibacter solanacearum, as has also been reported for Xanthomonas
arboricola pv. corylina (22) in hazelnuts and Xanthomonas campestris pv.
musasearum (32) in banana.
The differences in the spatial patterns found in the distribution
of H. rubrisubalbicans, both in physical space in the region and between
the two years of the study are similar to those reported by Contreras-Rendón et al. (2014) for Candidatus
Liberibacter solanacearum in potato crops. The spatial distribution fit the
pentaspherical model in 2016, which indicates that the aggregations are found
in specific points but at low incidences in eight genotypes. On the other hand,
the spatial distribution in 2017 was best fit by the spherical model,
indicating the existence of focalized aggregations (4)
with a higher percent incidence. Our maps based on the spatial distribution of
mottled stripe over a continuous space help detect the areas that are most
severely affected and require immediate control measures (29).
These maps can also be useful to associate particular environmental
characteristics with patterns of disease distribution, which can point to
possible preferences in the aggregation structure of the bacteria in the study
region (21). Here, changes in the
spatial distribution of the disease from one year to the next and the greater
number of new outbreaks of the bacteria in 2017 are likely due to the presence
of susceptible genotypes and a favorable environment.
Conclusion
The chlorotic mottling of sugar cane showed an aggregate type
spatial behavior at the regional level. There was some difference in spatial
patterns between years, which corresponded with an increase in precipitation
and more susceptible sugar cane genotypes. However, the patterns in both years
showed consistently focalized points.
Acknowledgments
Thanks to
the Agricultural Sciences and Natural Resources Program at the Agricultural
Sciences Faculty at the Autonomous University of Mexico State, which provided space, knowledge, and support for the doctoral
studies of RQV. We thank the Consejo Nacional de Ciencia y Tecnología
(CONACYT) for the scholarship provided through the Programa de Ciencias
Agropecuarias y Recursos Naturales of the UAEMex. Thanks to the Fondo Sectorial
SAGARPA/CONACYT for funding provided through the CONACYT program
2013-02-230876, grant SAGARPA 2013-2. To the directors of the San Cristóbal
Sugarmill in Carlos A. Carrillo, Veracruz, we extend our congratulations and
thanks for the collaboration and facilities provided during this research.
1.
Agresti, A. 2002. Categorical Data Analysis. Hoboken,
New Jersey. USA. John Wiley & Sons, Inc. 752 p.
2.
Agrios, N. G. 2004. Fitopatología. México.
D. F. Editorial Limusa. 854 p.
3.
Altschul, S. F.; Madden, T. L.; Schäffer, A. A.; Zhang, J.; Zhang, Z.; Miller,
W.; Lipman, D. J. 1997. Gapped BLAST and PSI-BLAST: a new generation of protein
database search programs. Nucleic Acids Res. 25:3389-3402.
4.
Alves-Rodrigues, I. 2006. Saccharomyces cerevisiae: a useful model host
to study fundamental biology of viral replication. Virus Res. 120: 49-56.
5.
Baldani, J. I.; Pot, B.; Kirchhof, G.; Falsen, E.; Baldani, V.; Olivares, F.
l.; Hoste, B.; Kersters, K.; Hartmann, A.; Gillis, M.; Döbereiner, J. 1996.
Emended description of Herbaspirillum; inclusion of [Pseudomonas] rubrisubalbicans, a
milk plant pathogen, as Herbaspirillum rubrisubalbicans comb. nov.; and classification of a group of clinical isolates (EF group
1) as Herbaspirillum species 3. Int J Syst Evol Microbiol. 46:
802-810, https://doi:10.1099/00207713-46-3-802.
6.
Belan, L. L.; Pozza, E. A.; Alves, M. C.; Freitas, M. L. O. 2018. Geostatistical analysis of bacterial blight in coffee tree
seedlings in the nursery. Summa Phytopathologica. 44:317-325.
7.
Bivand, R.; Pebesma, E.; Gómez-Rubio, V. 2008. Applied
spatial data analysis with R. New York, USA. Springer.
423 p.
8.
CONAGUA-CONADESUCA. 2018. Datos del cierre
2017 de la Comisión Nacional del Agua. https://www.gob.mx/conagua . Accessed 25 august 2020.
9.
Contreras-Rendón, A.; Gutiérrez-Ibáñez, A. T.; Silva-Rojas, H. V.;
Sánchez-Pale, J. R.; Laguna-Cerda, A.; Ramírez-Dávila, J. F. 2014. Distribución Espacial de Candidatus Liberibacter
solanacearum y Bactericera cockerelli (Sulc) (Hemiptera: Triozidae)
en Papa (Solanum tuberosum L.). Southwes.
Entomol. 41:105-114. htpp://doi:
10.3958/059.041.0112.
10.
Cressie, N. 1985. Fitting variogram models by weighted least squares. Math. Geol. 17:563-586.
11.
Cruz-Cárdenas, G.; Villaseñor, J. L.; López-Mata, L.; Ortiz, E. 2013. Distribución espacial de la riqueza de especies de
plantas vasculares en México. Rev. Mex. de Biodivers. 84:
1189-1199.
12.
Demirozer, O.; Tyler-Julian, K.; Funderburk, J.; Leppla, N.; Reitz, S. 2012. Frankliniellla
occidentalis (Pergande) integrated pest management programs for fruiting
vegetables in Florida. Pest Manag. Sci.
68:1537-1545.
13.
Doyle, J. J.; Doyle, J. L. 1990. Isolation of plant DNA from
fresh tissue. Focus. 12: 13-15.
14. Dutra Filho, J. de A.; Silva Souto, L.; Gil de Luna, R.; dos
Santos Souza, A.; Gomes-Silva, F.; Cavalcante Silva, F. A.; Simões Neto, D. E.;
Calsa Júnior, T. 2021. Mixed modeling for fiber yield genetic selection in
sugarcane (Saccharum officinarum). Revista de la Facultad de Ciencias Agrarias. Universidad
Nacional de Cuyo. Mendoza. Argentina. 53(2): 11-19.
15. Flores-Cáceres, M. L.; Hattab, S.; Banni, M.; Boussetta, H.;
Hattab, S.; Escobar, C.; Hernández, L.; 2015. Specific mechanisms of tolerance
to copper and cadmium are compromised by limited concentration of glutathione
in alfalfa plants. Plant Sci. 233: 165-173.
16. Goovaerts, P. 1999. Geostatistics in soil science:
state-of-the-art and perspectives. Geoderma. 89: 1-45.
17. Groves, R. L.; Chen, J.; Civerolo, E. L.; Freeman, M. W.;
Viveros, M. A. 2005. Spatial analysis of almond leaf scorch disease in the San
Joaquin Valley of California: Factors affecting pathogen distribution and
spread. Plant Dis. 89: 581-589.
18. Hale, C. N.; Wilke, J. P. 1972. A
comparative study of Pseudomonas species pathogenic to sorghum. New Zeal. J. Agr. Res. 15: 448-456.
19. Hall, T. A. 1999. BioEdit: a user friendly biological sequence
alignment editor and analysis program for windows 95/98/NT. Nucleic Acids Symp.
Ser. 41: 95-98.
20. Isaaks, E. H.; Srivastava, R. M. 1989. An
introduction to Applied Geostatistics. New York, USA. Oxford
University Press. 592 p.
21. Karimzadeh, R.; Hejazi, J.; Helali, H.; Iranipour, S.;
Mohammadi, A. 2011. Analysis of the spatiotemporal distribution of Eurygaster
integriceps (Hemiptera: Scutelleridae) by using spatial analysis by
distance indices and geostatistics. Environ. Entomol. 40:
1253-1265.
22. Lamichhane, J. R.; Fabi, A.; Ridolfi, R.;
Varvaro, L. 2013. Epidemiological Study of Hazelnut Bacterial
Blight in Central Italy by Using Laboratory Analysis and Geostatistics. PLoS ONE 8: e56298. Https://doi: 10.1371/journal.pone.0056298.
23. Navas-Cortés, J. A.; Landa, B. B.;
Mercado-Blanco, J.; Trapero-Casas, J. L.; Rodríguez-Jurado, D.; Jiménez-Díaz,
R. M. 2008. Spatiotemporal analysis of spread of infections by Verticillium
dahliae pathotypes within a high tree density olive orchard in southern
Spain. Phytopathology. 98: 167-180.
24. Pebesma, E. 2004. Multivariable geostatistics in R: the gstat
package. Comput Geosci. 30: 683-691.
25. Peterson-Townsend, A.; Soberón, J.; Pearson, R.; Anderson, R.;
Martínez-Meyer, E.; Nakamura, M.; Araújo, B.; Peterson, G. L.; Berner, D. K.
2011. Ecological Niches and Geographic Distributions.
Nueva Jersey, USA. Princeton University Press. Princeton. 328 p.
26. Pocovi, M. I.; Collavino, N. G.;
Gutiérrez, Á.; Taboada, G.; Castillo, V.; Delgado, R.; Mariotti, J. A. 2020. Molecular versus morphological markers to describe variability in
sugar cane (Saccharum officinarum) for germplasm management and
conservation. Revista de la Facultad de Ciencias Agrarias . Universidad
Nacional de Cuyo. Mendoza. Argentina. 52(1): 40-60.
27. Quiñones-Valdez, R.; Sánchez-Pale, J. R.;
Castañeda-Vildozola, A.; Franco Mora, O.; Johansen-Naime, R.; Mejorada-Gómez,
E. 2020. Comportamiento espacial y temporal de Thrips simplex Morison
(Thysanoptera: Thripidae) en la región norte del Estado de México. Acta
Zoológica Mexicana (nueva serie) 36: 1-15.
https://doi.org/10.21829/azm.2020.3611161
28. Quisehuatl-Tepexicuapan, E.; Ferrera-Cerrato, R.; Silva-Rojas,
H. V.; Rodriguez-Zaragoza, S.; Alarcon, A.; Almaraz-Suarez, J. J. 2016. Free-living culturable bacteria and protozoa from the rhizoplanes
of three floating aquatic plant species. Plant
Biosyst. 150: 855-865.
29. R Core Team. 2012. R: A language and environment for
statistical computing. R Foundation for Statistical
Computing, Vienna, Austria. Available: http://www.R-project.org/. Accessed 8 February 2021.
30. Rivera-Aguilar, N.; Galindo-Mendoza, G.; Fortanelli-Martínez,
J.; Contreras-Servín, C. 2011. Factores de competitividad de la
agroindustria de la caña de azúcar en México. Reg. Soc. 23: 261- 297.
31. Sánchez-Pale, J. R.; Ramírez-Dávila, J.
F.; González-Huerta, A.; De León C. 2011. Modelization of the
spatial distribution of corn head smut (Sporisorium reilianum Langdon
and Fullerton) in México. Span. J. Agric. Res. 9: 882-893.
32. Shimwela, M. M.; Blackburn, J. K.; Jones, J. B.; Nkubal, J.;
Narouei-Khandan, H. A.; Ploetz, R. C.; Beed, F.; Van Bruggen, A. H. C. 2016. Local and regional spread of banana Xanthomonas wilt (BXW) in space
and time in Kagera, Tanzani. Plant Pathol. 8:
939-951.
33. SIAP. 2016. Anuario estadístico de la
producción agrícola en México. http://www.siap.gob.mx/cierre-de-la-producción-agrícola-por-estado/ Accesed 19 January
2020.
34. Silva-Rojas, H. V.; Rebollar-Alviter, A.;
Valdez-Balero, A.; Sánchez-Pale, J. R.; Osnaya-González M. L. 2017. Herbaspirillum
rubrisubalbicans canding important emergent diseases in Sugar cane in México.
Phytopathology 107: S4.19.
35. Vieira, T. R.; Cunha, M.; Garrutti, D.;
Duarte, T. F.; Felex, S. S.; Pereira, J .M.; Madruga, M. S. 2010. Physical and
sensorial properties of Santa Ines lamb meat terminated in diets with
increasing levels of whole cotton seed (Gossypium hirsutum). Cienc. Tecnol. Aliment.
30: 372-377.