Revista de la Facultad de Ciencias
Agrarias. Universidad Nacional de Cuyo. Tomo 55(1). ISSN (en línea) 1853-8665.
Año 2023.
Original article
Does
harmonization reduce the impact of SPS measures on agricultural exports? An
assessment from the Chilean fruit sector
¿La armonización reduce el impacto de las MSF en las exportaciones
agrícolas? Una evaluación desde el sector frutícola chileno
Jazmín Muñoz 2
1 Universidad de Chile. Facultad de Ciencias Agronómicas. 8820808.
Santiago. Chile.
2 Universidad de Chile. Instituto de Estudios Internacionales.
7500753. Santiago. Chile.
3
Centre for International Sustainable Development Law & London School of
Economics and Political Science.
Abstract
Non-tariff
measures (NTMs) are relevant to agricultural trade policies, especially since
trade negotiations have significantly decreased tariffs. Countries impose
Sanitary and Phytosanitary Measures (SPS), a technical NTM, to protect human,
animal, and plant health by regulating specific food quality and safety
aspects. This article aims to assess the impact of SPS measures imposed by
Chile’s main trading partners on agricultural trade, specifically on the value
of fruit exports. It also seeks to determine the effects of harmonizing
technical regulations between Chile and its partners. We estimated a gravity
equation as a negative binomial regression model with Chilean fruit exports to
main destination markets from 2010 to 2019 as the dependent variable. Our
results confirm a negative impact of foreign SPS measures on Chilean fruit
exports. However, that impact is mitigated if Chile has a harmonized SPS
measure. Thus, we can conclude that harmonization reduces the negative effects
of foreign SPS measures on exports. Our results suggest that trade agreements,
which often contain a chapter on SPS, positively contribute to SPS
harmonization and mitigate SPS’s negative impacts on trade flows.
Keywords: Non-tariff measures; Sanitary and phytosanitary measures; Harmonization; Food
safety; Agricultural trade; Fruit exports.
Resumen
Las medidas
no arancelarias (MNA) son relevantes para las políticas comerciales agrícolas,
especialmente porque las negociaciones comerciales han reducido significativamente
los aranceles. Los países imponen Medidas Sanitarias y Fitosanitarias (MSF),
una MNA técnica, para proteger la salud humana, animal y vegetal mediante la
regulación de aspectos específicos de calidad e inocuidad de los alimentos.
Este artículo tiene como objetivo evaluar el impacto de las MSF impuestas por
los principales socios comerciales de Chile en el comercio agrícola,
específicamente en el valor de las exportaciones de frutas. También busca
determinar los efectos de la armonización de normas técnicas entre Chile y sus
socios. Estimamos una ecuación gravitacional como un modelo de regresión
binomial negativo con las exportaciones de frutas chilenas a los principales
mercados de destino de 2010 a 2019 como variable dependiente. Nuestros
resultados confirman un impacto negativo de las medidas sanitarias y
fitosanitarias extranjeras en las exportaciones de frutas chilenas. Sin
embargo, ese impacto se mitiga si Chile cuenta con una MSF armonizada. Por lo
tanto, podemos concluir que la armonización reduce los efectos negativos de las
medidas sanitarias y fitosanitarias extranjeras sobre las exportaciones.
Nuestros resultados sugieren que los acuerdos comerciales, que a menudo
contienen un capítulo sobre MSF, contribuyen positivamente a la armonización de
MSF y mitigan los impactos negativos de MSF en los flujos comerciales.
Palabras clave: Medidas no arancelarias; Medidas sanitarias y fitosanitarias; Armonización; Inocuidad; Comercio agrícola; Exportaciones
frutícolas.
Originales: Recepción:
24/12/2021
Aceptación: 26/04/2023
Introduction
Non-tariff
measures (NTMs) are increasingly present in international trade regulation (20). Following the United Nations Conference on Trade and
Development, NTMs were defined as policy measures separate from standard
customs tariffs that may economically impact international trade in goods,
specifically in quantities, prices, or both (52). The literature cites that, in some cases, NTMs are replaced by
Non-tariff barriers (NTBs). Both concepts are very close, almost synonyms;
however, the term “barrier” implies a higher probability of negative impact on
trade than “measure.” Deardorff and Stern (1997)
state formal and informal NTBs. Formal NTBs appear in official legislation and
governmental mandates. On the other hand, informal NTBs arise from
administrative procedures and unpublished regulations and policies, market
structure, and institutional framework. Moreover, informal NTBs are often
disguised to protect the national industry from foreign competition (18).
NTMs are
classified into three general groups: import technical measures, import
non-technical measures, and export measures. Within the technical NTMs are
sanitary and phytosanitary (SPS) measures, technical barriers to trade,
pre-shipment inspections, and other formalities (53). SPS measures protect
human, animal, and plant health by regulating specific quality and safety
aspects for domestic and imported products. They are subject to multilateral
regulation through the World Trade Organization Agreement on the Application of
Sanitary and Phytosanitary Measures (WTO SPS Agreement). The objective of the
SPS Agreement is to ensure that countries can adopt and enforce legitimate SPS
measures and to prevent those measures that are real trade barriers disguised
as SPS measures (34). The SPS Agreement
requires that countries justify their measures through a risk assessment based
on scientific evidence (59). It also encourages
countries to use international SPS regulations when possible and accept the
regulations of other countries as equivalent if they reach an appropriate level
of protection. Countries must notify the WTO of initiating or modifying SPS measures
to promote transparency. However, there are often informal NTBs related to SPS,
especially administrative procedures such as unannounced inspections or
excessive bureaucracy at customs, also known as “red tape.” The literature
shows that red tape affects variable trade costs for exporting companies and
consequently impacts the extensive trade margin (37).
The analysis
of the impact of SPS and technical NTMs has generally focused on their effects
on trade. The standard approach in literature has been to model commercial
flows through gravity equations. SPS measures are often introduced in gravity
models by a dummy variable (presence/absence) and less frequently by “coverage”
and “frequency” ratios or by SPS ad valorem equivalence (8, 21).
The
heterogeneous conclusions on the impact of SPS measures on trade reached by
this research have depended on: the type of measure (2,
16, 17, 38, 55, 56); producer characteristics (24, 25, 32, 49, 57); the trading partners’
economic levels (31, 43, 45, 54); and
particularly, the level of harmonization of technical regulations between
trading partners (4, 22, 33, 42, 43). In
this, harmonization can be understood as the imposition of equivalent technical
measures directed at the same product (same tariff line) by two countries, for
instance, an alike regulation on the labeling of a product.
The
literature has shown, first, that low-income and developing countries’ exports,
specifically those from China and African countries, are negatively affected by
SPS measures. This especially occurs when countries have a lot of small,
national, or inexperienced companies, and their regulation is not harmonized
with that of the importing countries. In contrast, high-income countries are
the ones that impose the most SPS measures (10, 11).
As far as we know, there is no specific research on the trade effects of the
“red tape,” or unofficial NTBs, related to SPS measures. However, assessing the
effective impact of SPS measures on trade should also absorb that of the
procedures associated with their compliance. There, exporters from countries
with a history of SPS non-compliance may be subject to more recurrent and
severe border inspections (48). It is worth mentioning
that the impact of SPS measures not reported to the WTO is impossible to
measure with the usual method. However, it is expected that given the adherence
of the WTO members to the SPS Agreement, this percentage will be negligible.
As is generally the case
in Latin American countries, in Chile, the case study for this article,
agriculture and food are critical to the national economic strategy.
Agricultural, food and forestry exports represented over half the Chilean
non-copper trade revenue in 2020, totaling USD 15.9 billion FOB. Despite this,
aspects of the implications of technical NTMs and SPS measures on its trade
have not been thoroughly explored. The first investigations on technical NTMs
in Chile took a descriptive approach, with exporters as their source of information.
They concluded that food and agricultural trade was especially subject to NTMs,
with Latin American partners being the most stringent markets (41, 52, 58). Later, Engler
et al. (2012) compiled the managers’
opinions of fruit exporting companies to evaluate the stringency and
harmonization levels of the SPS measures imposed by Chile’s main markets. Melo et al. (2014) used
this information to estimate a gravity model where the relative weight of
Chilean fruits compared to the importing countries’ consumption and production
was the dependent variable. They showed that more stringent regulations have a
significant negative impact. More recently, De María et
al. (2018) identified the SPS measures faced by Chilean and French
apple exporters and scored their complexity. The authors concluded that the
Chilean exporters were more prepared for stringent markets than the French.
They suggested that the reason might be that Chilean technical regulations are
also demanding. Chile stands out in terms of food control capacity compared
with other countries in Latin America, especially in regulatory quality (12). However, throughout Latin America we can see how farmers are
concerned in producing in a more responsible way, as well as research is
focusing on ilustrate more sustainable value chains (7,
40).
This
article aims to assess the impact of the SPS measures imposed by Chile’s main
trading partners on the value of Chilean agricultural exports and determine the
effect of harmonizing these technical regulations. In this regard, we
hypothesize that harmonization contributes to mitigating SPS’s negative effects
on agricultural exports. We will specifically focus on fruit exports to
increase the homogeneity of our analysis; also, they represent 65% of the value
of Chilean agricultural exports. Chile is the fifth fruit exporter in the world
and the leader in the South Hemisphere. In addition, Chile is a developing
country, which has been - except for China and some African countries -
scarcely considered a case study on the existing SPS research.
Materials and methods
Collection of SPS measures data and descriptive analysis
The data on
SPS measures were collected from the WTO SPS Information Management System
database. This is the most comprehensive global database on SPS measures
available today. It contains an updated inventory with open access to all SPS
notifications reported to the WTO by its members, disaggregated by members
imposing the measure and partners and products (identified by Harmonized System
(HS) codes) affected by the action. A link to the relevant official documents
is also provided for each notification.
The
importing markets in this study were China, the United States, the European
Union, Japan, Mexico, South Korea, Brazil, Venezuela, Peru, and Taiwan,
representing the top 10 destination markets for Chilean agricultural products.
The SPS measures considered are their submissions to the WTO secretariat from
the beginning of 2010 to the end of 2019.
A
descriptive analysis of all the SPS notifications compiled will be carried out
once the final version of the database is completed. That analysis will focus
on characterizing the SPS measures by country imposing, year of submission,
measure type determined by the objective and instrument used, and products
involved. The country states the explicit SPS goals in submitting the measure
to the WTO. Countries can declare one or more explicit objectives for an SPS.
The possible objectives are food safety, which refers to “handling, preparing
and storing food in a way to reduce best the risk of individuals becoming sick
from foodborne illnesses” (5); plant protection, which is “the
ability to anticipate the emergence and spread of noxious organisms and to
prevent their introduction and spread before they become agricultural pests in
specific crops and regions” (6); protecting humans from
animal/plant pests or diseases, which could also be interpreted as biosecurity
or “trying to prevent new pests and diseases from arriving, and helping to
control outbreaks when they do occur” (30); and protecting the territory
from pest damage. The researchers assigned each measure an instrument following
the Crivelli and Gröschl (2012) methodology. Those
instruments relate to the type of requirements that the SPS asks. They are
associated with product characteristics such as pesticides, labeling,
additives, phytosanitary requirements, geographically protected zones, and
quarantine requirements, or with conformity assessment such as certificate
requirements, testing, inspection, approval procedures, pest risk analysis,
systems approach, and regulations. The objectives and instruments are shown in Table 1.
Table 1: Objectives and instruments commonly found in SPS measures.
Tabla 1: Objetivos
e instrumentos encontrados comúnmente en las MSF.
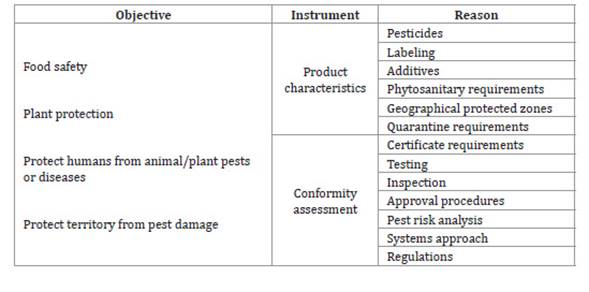
Source: Compiled by authors.
Fuente: Elaborado por los autores.
The products subject to
each SPS measure and the exported value data were collected considering the
tariff lines in chapter 08 from the harmonized system (HS 08): “Edible fruit
and nuts, peel of citrus fruits or melons.” It considered six digits codes, i.e.,
the most detailed international disaggregation level.
Methodological approach and empirical model for impact assessment
The use of
gravity equations to explain international trade flows was first developed by Tinbergen (1962), who enunciated that the exports from
country i to country j depend on the gross national product (GNP)
of country i; the GNP of country j and the geographic distance
between country i and country j. The author stated that
additional variables could be added to the model, such as common borders or
trade agreements between countries.
There have
been significant adjustments in the theoretical foundations and application of
the gravity equation model. It was shown that log-linear models by ordinary least
squares (OLS) have some associated problems when estimating, such as selection
bias. Heckman (1979) proposed using the estimation
of a sample selection equation (Probit) before the gravity model by OLS. He
also suggested using joint maximum likelihood estimation to avoid efficiency
problems, which was later supported by Amemiya (1981)
and Maddala (1983). However, Santos
Silva and Tenreyro (2006, 2011) criticized the fact that Heckman’s model
assumes normality and homoscedasticity of error terms and ignores the effects
of Jensen’s inequality (E(Iny)
≠ InE(y) being any random variable). The authors proposed using a
Poisson model by pseudo maximum likelihood (PML). Later, Burger
et al. (2009) adapted Santos Silva and Tenreyro’s model when
problems of overdispersion appear - as Poisson assumes equi-dispersion - using
a negative binomial regression.
Negative
binomial regression specifies the variance as a function not just of the mean
but also of a particular scattering parameter (14). According to Greene (2018), for mathematical convenience, the
parameter ui assumes a gamma
distribution
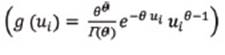 so the expression for
the density of yi is:
so the expression for
the density of yi is:
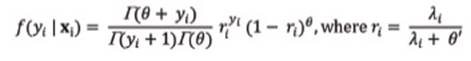
Considering
this framework, the empirical model in this research is a negative binomial
gravity equation regression, generally specified as:
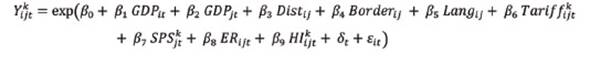
where:
b1... b9 =
the parameters to be estimated
dt = vector
for year dummies
eit = the
error term of the model
To alleviate the assumption of
independence of the observations, we will estimate the model clustering by HS
codes, as we can suppose similarities between comparable products. The
independent variables in the model are defined in Table 2.
Table 2: Definition of the
independent variables in the model.
Tabla 2: Definición
de las variables independientes en el modelo.
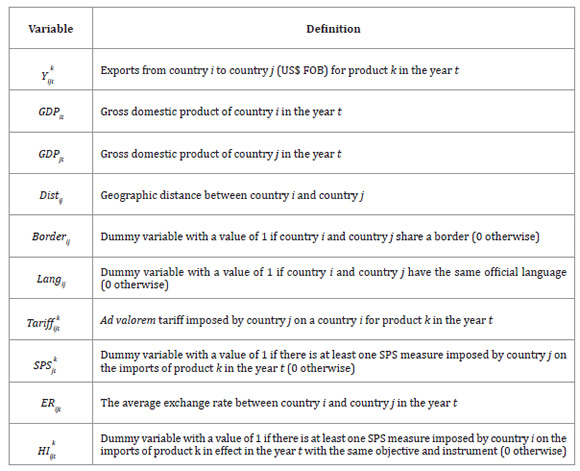
Source: Compiled by authors.
Fuente: Elaborado por los autores.
Data for
the export value (US$ FOB) of each tariff line (HS 08) were obtained from the
World Bank WITS facility, except for Taiwan, whose data were collected from the
database of the Chilean Office of Agricultural Studies and Policies (ODEPA).
Most macroeconomic information on countries’ gross domestic product was
obtained from the World Bank World Development Indicators database. In the case
of Taiwan, the data was obtained from the National Statistics of the Republic
of China database, and Venezuela’s information between 2015 and 2019 was collected
from the Economic Commission for Latin America and the Caribbean (CEPALSTAT).
The geographic distances between countries (as the sum of distances between
major cities weighted by their population), the existence of a common border,
and a language linkage were obtained, besides national sources, from the
databases of the Centre d’Etudes Prospectives et d’Informations Internationales
(CEPII). Tariff data was obtained from the WTO’s Tariff Analysis Online (TAO)
database when available and from the texts of the FTAs between Chile and each
partner.
In some cases, the
equivalent ad-valorem tariff was considered when there was no ad-valorem
tariff information in TAO. The information was obtained from the Market
Access Map from the International Trade Centre. Exchange rates were collected
from the Central Bank of Chile database. Details on importing countries’ SPS
measures came from the database on notifications previously created and
detailed in the preceding subsection. However, for inclusion in the gravity equation,
we aggregated the observations of all the measures that affect a tariff line k.
First, information on Chilean SPS measures was collected from the WTO SPS
Information Management System for the harmonization dummy. Then it was compared
with our SPS database.
Results
Descriptive analysis of the SPS measures
In total,
424 SPS notifications were reported for fresh fruits by Chile’s main export
destinations between 2010 to 2019. The number of measures reported each year
increased throughout the period. From 2010 to 2013, the annual measure
notification average was 17.5; from 2014 to 2016, it was 35.6; from 2017 to
2019, it was 82.3. Japan imposed the most measures, followed by Brazil and the
United States. The other countries imposed much fewer and in this descending
order: Taiwan, European Union, China, Korea, Peru, and Mexico. The most common
objective of the measures was “food safety” and, to a lesser extent, “plant
protection.” The main instrument used by the SPS measures was “product characteristics,”
with 375 notifications, while “conformity assessment” was in only 49
notifications. There were 325 that gave Maximum Residues Levels (MRLs) on
Pesticides as a reason, and all other reasons were sporadic. A great diversity
of products were involved since a notification can cover several tariff lines.
When disaggregating the 424 notifications by tariff lines in each case, they
covered 75 different HS-08 codes. The most affected products by the SPS
measures under study were tropical fruits, berries, citrus, melons, and apples.
SPS impact assessment
The
estimation results of the specified model are detailed in Table 3.
Table 3: Negative binomial gravity model: estimation results.
Tabla 3: Modelo
gravitacional binomial negativo: resultados de la estimación.
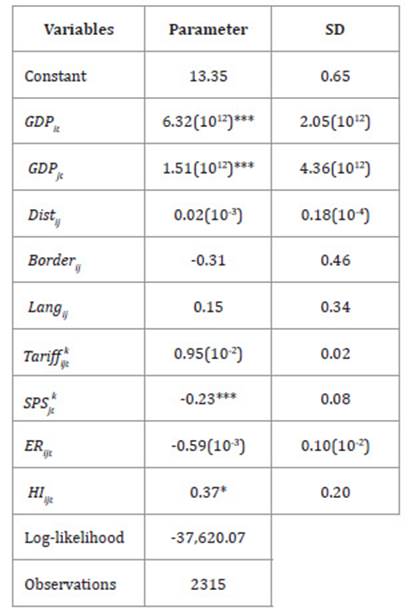
Dependent variable: Value of exports from country i (Chile)
to country j (US$ FOB) for product k in the year t. The
dummy variable for the years 2018 and 2019 was omitted for collinearity.
*Significant at 10%; ** Significant at 5%; *** Significant at 1%. Source:
Compiled by authors.
Variable dependiente: Valor de las exportaciones del país i (Chile)
al país j (Dólares americanos FOB) para el product k en el año t.
La variable dummy para los años 2018 y 2019 fue omitida por colinealidad. *
Significativo al 10%; ** Significativo al 5%; *** Significativo al 1%. Fuente: Elaboración propia.
The
second column contains the estimated coefficients, four statistically
significant. The third column contains the related standard deviation.
On the specific results, the
variables GDPit (p<0.01), GDPjt (p<0.01)
and HIijt (p<0.1) have a positive association with the
value of fruit exports from Chile to its main destination markets, while SPS kjt
(p<0.01) has a negative impact. Finally, the variables Distij,
Borderij, Langij, Tariffijtk and
ERijt are non-significant for the value of fruit exports.
Discussion
The number
of SPS measures notified to the WTO grew during the period under study. This is
consistent with Correa and Moreira’s (2021) results
from reviewing the evolution in SPS measure notifications since 2000, showing
an increasing trend. The authors highlight the role of large commodity
exporters like Brazil and developed countries in generating SPS notifications.
Our findings for characterizing SPS measures on fruits by notifying countries
are also coherent with those results. Boza and Muñoz
(2017) evidenced that high-income countries’ legal and technical
capabilities are key factors that justify their outsized participation in SPS
notifications.
Most of the
identified SPS measures address food safety by regulating MRLs for pesticides.
This is consistent with Grübler and Reiter (2021),
who compiled and analyzed a dataset on NTM notifications from 1995 to 2019.
They showed that the most common keyword for SPS notifications was “food
safety,” and the fourth was “maximum residue level.” Tiu
(2021) describes MRLs as a “never-ending challenge” since pesticide
technology advances so fast that there are always new issues.
Our gravity
model showed a negative impact of SPS measures on the value of Chilean fruit
exports. As Orefice (2017) points out, even though SPS
measures are imposed to protect consumers’ health, they de facto increase
trade costs, which would also help explain our results. The high presence of
MRLs in the SPS measures imposed by Chile’s main markets might also be related
to our findings. Hejazi et al. (2018) used
U.S. exports to show that MRLs constrain international fruit and vegetable
trade, decreasing the export probability and intensity. Xiong
and Beghin (2017) presented some results that qualify those of Hejazi et al. (2018). After applying a gravity
model for MRLs imposed by high-income countries, the authors showed that they
negatively affect export supply but positively impact import demand, which they
suggest is related to risk mitigation.
Hejazi et al. (2018) also demonstrated that the
negative impact of SPS measures on trade increases when there is a more
significant difference between the MRLs mandated by each trading partner for a
given pesticide and commodity. Our results aligned as our proxy variable to
harmonization (HIijt),
has a significant and positive relation to Chilean fruit exports. This specific
outcome is coherent with our hypothesis that harmonization mitigates the
adverse effects of SPS on agricultural exports and with existing literature
that supports the idea (e.g., 4, 22, 33, 42, 43). The 26 Free Trade
Agreements (FTAs) that Chile has in effect, with a chapter on SPS measures that
enhances communication and coordination between the parties, might have
contributed to improving harmonization. Also, Chile has produced many SPS
notifications (11, 15). This may help
Chilean exporters meet foreign SPS measures, especially when those measures are
comparable to national requirements.
Tariffs were
not significant to Chilean fruit export values. This might also be related to
the large number of FTAs that Chile has in effect. The chapters on market
access in those agreements present a list of tariff reduction commitments. As a
result, the tariffs faced by Chilean companies when exporting fruit to its main
destination markets should not represent a significant barrier. By 2010, Chile
had signed FTAs with all destinations but Brazil, Taiwan, and Venezuela;
however, these three countries represented only 7.3% of Chilean fruit exports
to the selected destinations in the timeframe studied. Thus, most destinations
had reduced or eliminated tariffs on Chilean fruits in the analyzed period.
Additionally,
the main three markets for Chilean fruit from 2010 to 2019 were China, the
European Union, and the United States, representing 84% of the fruit exports.
Their main imported fruits were cherries, fresh grapes, blueberries, avocados,
and apples. Most products entered those markets with zero tariffs or, in the
case of China, significantly reduced tariffs compared to suppliers with no
trade agreements, which may also explain our model’s result.
The
exchange rate was also non-significant to Chilean fruit export values. Chile
has been distinguished by its stability even in the face of external shocks (1). Distance from the importing
country and sharing a common language or border were also non-significant. The
advantage of the counter-season with the Northern Hemisphere is one factor that
justifies the expansion of Chilean fruit exports (35), as opposed to targeting
countries by geographical or cultural proximity. China, Chilean’s current main
market for agricultural products, is in its antipodes. This strategy might also
explain the significant and positive coefficient for the importer GDP, i.e.,
Chile has privileged the market size.
Conclusion
This article
aimed to assess the impact of SPS measures imposed by Chile’s main trading
partners on the value of Chilean agricultural exports and determine the effect
of harmonization of these technical regulations. We hypothesized that
harmonization mitigates SPS’s negative impact on agricultural exports. The
gravity equation estimates confirm our hypothesis, as the presence of an SPS
measure imposed by the importing country has a significant and negative
relationship with the export value for a given fruit product. Meanwhile, the
existence of an SPS measure imposed by Chile for the same product and objective
(our proxy of a harmonized SPS) has a significant and positive effect.
Then, how to
ease the consequences of SPS measures on trade? Harmonization reduces the
effects of SPS measures on exports. The extensive list of trade agreements
Chile has signed might positively contribute to SPS harmonization, as most have
an SPS chapter that encourages coordination. In this regard, Chile recently
initiated the ratification process for the Agreement for Transpacific
Partnership (TPP). This agreement is a paradigmatic example of a mega-trade
deal. It contains a chapter on SPS that looks for higher integration between
partners, eventually limited by their technical differences. The effects of the
TPP on SPS harmonization are to be seen; however, in Chile, they might be
marginal, as the country already has previous FTAs with every signatory member.
On the other
hand, trade facilitation simplifies procedural and administrative impediments
to trade - i.e., “red tape,” and today, is an essential part of
international negotiations. According to OECD Trade Facilitation Indicators,
Chile is among the highest-ranked countries, especially in governance,
procedures, and information availability. Since 2019, Chile has had a National
Trade Facilitation Committee as part of its Ministry of Foreign Affairs.
Thus, Chile
- and other similar economies - should continue relating in a fluid and
transparent way with its trading partners, with the aim of cooperation. Given
the off-season, it is crucial to consider that Chilean fruit exports do not
compete directly in its main markets (US, China, EU) with the national fruit
industry, which might encourage maintaining and increasing cooperation.
1. Albagli, E.; Calani, M.; Hadzi-Vaskov, M.; Marcel, M.; Ricci,
L. A. 2020. Comfort in floating: Taking Stock of Twenty Years of Freely-Floaty
Exchange Rate in Chile. IMF Working Paper WP/20/100. 48 p. doi:
https://doi.org/10.5089/9781513547718.001
2. Almeida, F.; Gomes, M.;
Silva, O. 2014. Notificações aos Acordos TBT e SPS: diferentes objetivos e
resultados sobre o comércio internacional de agroalimentos. Revista de Economia
e Sociologia Rural. Brasil. 52(1): 157-176. doi:
https://doi.org/10.1590/S0103-20032014000100009
3. Amemiya, T. 1981.
Qualitative Response Models: A Survey. Journal of Economic Literature. 19(4):
1483-1536.
4. Arita, S.; Beckman, J.;
Mitchell, L. 2017. Reducing transatlantic barriers on U.S.-EU agri-food trade:
What are the possible gains? Food Policy. 68: 233-247. doi:
https://doi.org/10.1016/j.foodpol.2016.12.006
5. Australian Department
of Agriculture, Fisheries and Forestry. 2022a. Protect your animals and plants
from pests and diseases. https://www.agriculture.gov.au/biosecurity-trade/pestsdiseases-weeds/protect-animal-plant . (Accessed: December 2022).
6. Australian Institute of
Food Safety. 2022b. What is Food Safety? https://www.foodsafety.com.au/blog/what-is-food-safety . (Accessed: December 2022).
7. Bañuelos Torróntegui,
K. A.; Avendaño Ruiz, B. D.; Martínez-Carrasco Pleite, F. 2021. Implantation of
corporate social responsibility measures in the horticulture in Mexico and
Spain. Revista de la Facultad de Ciencias Agrarias. Universidad Nacional de
Cuyo. Mendoza. Argentina. 53(2): 165-177.
8. Beghin, J.; Xiong, B. 2018. Trade and welfare effects of
technical regulation and standards. In: De Melo, J.; Nicita, A. (Eds.).
Non-Tariff Measures: Economic Assessment and Policy Options for Development.
Geneva, Switzerland, United Nations Conference on Trade and Development.
159-193.
9. Boza, S. 2018. Sanitary and
phytosanitary measures in the context of the CPTPP agreement. Biobased and
Applied Economics. 7(1): 87-98. doi:
10.13128/BAE-24049
10. Boza, S.; Fernández, F. 2016. World Trade Organization
members’ participation in mechanisms under the Sanitary and Phytosanitary
Agreement. International Journal of Trade and Global Markets. 9(3): 212-227. doi: https://doi.org/10.1504/IJTGM.2016.077850
11. Boza, S.; Muñoz, J.
2017. Factors underlying sanitary and phytosanitary regulation for food and
agricultural imports notified by WTO members. Journal of International Trade
and Economic Development. 26(6): 712-723. doi:
https://doi.org/10.1080/09638199.2017.1293712
12. Boza, S.; Rivers, R.;
Rozas, J. M.; Muñoz, J. 2018. Implications of Non-Compliance with Technical
Non-Tariff Measures: The Case of Chilean Food-Related Export Refusals at the
United States Border. In De Melo & Nicita (eds.), Non-Tariff Measures:
Economic Assessment and Policy Options for Development. UNCTAD - United Nations
Conference on Trade and Development. Geneva. Switzerland. p. 225-253.
13. Burger, M. J.; Van
Oort, F. G.; Linders, G. J. 2009. On the Specification of the Gravity Model of
Trade: Zeros, Excess Zeros and Zero-Inflated Estimations. Spatial Economic
Analysis. 4(2): 167-190. doi:
https://doi.org/10.1080/17421770902834327
14. Cameron, A. C.;
Trivedi, P. K. 1986. Econometric models based on count data. Comparisons and
applications of some estimators and tests. Journal of Applied Econometrics.
1(1): 29-53. Doi: https://doi.org/10.1002/jae.3950010104
15. Correa, C.; Moreira,
M. 2021. Sanitary and phytosanitary measures and their effects on world
agricultural exports. In 31st International
Conference of Agricultural Economists. International Association of
Agricultural Economists. doi:
https://doi.org/10.22004/ag.econ.315137
16. Crivelli, P.; Gröschl,
J. 2012. SPS Measures and Trade: Implementation Matters. World Trade
Organization Staff Working Paper ERSD-201 2-05. Geneva. WTO. 30 p.
17. Crivelli, P.; Gröschl,
J. 2016. The Impact of Sanitary and Phytosanitary Measures on Market Entry and
Trade Flows. The World Economy. 39(3): 444-473. doi:
https://doi.org/10.1111/twec.12283
18. Deardorff, A.; Stern,
R. 1997. Measurement of Non-Tariff Barriers. OECD Economics Department Working
Papers 179. OECD Publishing. Paris. 117 p.
19. De María, F.; Lubello,
P.; Drogué, S. 2018. Measuring the complexity of complying with phytosanitary
standard: the case of French and Chilean fresh apples. Bio-based and applied
economics. 7(1): 39-58. doi:
https://doi.org/10.13128/BAE-24047
20. De Melo, J.; Nicita,
A. 2018. Non-Tariff Measures: Data and Quantitative Tools of Analysis. In: De
Melo, J.; Nicita, A. (Eds.). Non-Tariff Measures: Economic Assessment and
Policy Options for Development. Geneva, Switzerland, United Nations Conference
on Trade and Development. 81-119.
21. Dolabella, M. 2020.
Bilateral effects of non-tariff measures on international trade. Volume based
panel estimates. International Trade series, No. 155 (LC/TS.2020/107).
Santiago. Economic Commission for Latin America and the Caribbean (ECLAC). 66
p.
22. Drogué, S.; Demaria,
F. 2012. Pesticides residues and trade, the apple of discord? Food Policy.
37(6): 641-649. doi: https://doi.org/10.1016/j.foodpol.2012.06.007
23. Engler, A.;
Nahuelhual, L.; Cofré, G.; Barrena, J. 2012. How far from harmonization are
sanitary, phytosanitary and quality-related standards?
An exporter’s perception approach. Food Policy. 37: 162-170. doi:
https://doi.org/10.1016/j.foodpol.2011.12.003
24. Gibson, M. J.; Wang,
Q. 2018. Sanitary and phytosanitary measures in Chinese agricultural exports:
the role of trade intermediaries. Applied Economics. 50(27): 3007-3015. doi: https://doi. org/10.1080/00036846.2017.1414932
25. Grant, J.; Peterson,
E.; Ramniceanu, R. 2015. Assessing the Impact of SPS Regulations on U.S. Fresh
Fruit and Vegetable Exports. Journal of Agricultural and Resource Economics.
40(1): 144-163. doi:
https://doi.org/10.22004/ag.econ.197381
26. Greene, W. H. 2018.
Econometric Analysis. 8th Ed.
New Jersey. Pearson. 1126 p.
27. Grübler, J.; Reiter,
O. 2021. Characterising non-tariff trade policy. Economic Analysis and Policy.
71: 138-163. https://doi.org/10.1016/j.eap.2021.04.007
28. Heckman, J. 1979.
Sample selection bias as a specification error. Econometrica. 47(1): 153-161. doi: https://doi.org/10.2307/1912352
29. Hejazi, M.; Grant, J.
H.; Peterson, E. B. 2018. Hidden Trade Costs? Maximum Residue Limits and U.S.
Exports of Fresh Fruits and Vegetables. Research report CAT-2018-06. Center for
Agricultural Trade Virginia Tech. U.S. 47 p.
30. IAPPS. 2022.
Introduction to Plant Protection. https://www.plantprotection.org/plant-protectionintroduction/ (Accessed: December 2022).
31. Kang, J. W.; Ramizo,
D. M. 2017. Impact of Sanitary and Phytosanitary Measures and Technical
Barriers on International Trade. Journal of World Trade. 51(4): 539-573.
32. Kareem, O. I. 2016. European Union’s sanitary and
phytosanitary measures and food exports. International Journal of Trade and
Global Markets. 9(4): 287-304. doi: https://doi.
org/10.1504/IJTGM.2016.081141
33. Kinzius, L.; Sandkamp, A.;
Yalcin, E. 2019. Trade protection and the role of non-tariff barriers. Review
of World Economics. 155: 603-643. doi: https://doi.org/10.1007/s10290-019-
00341-6
34. Koul, A. K. 2018. Guide to the WTO and GATT: Economics, Law
and Politics. Berlin, Germany. Springer. 705 p.
35. Lebdioui, A. 2019.
Chile’s Export Diversification since 1960: A Free Market Miracle or Mirage?
Development and Change. 50(6): 1624-1663. doi:
https://doi.org/10.1111/dech.12545
36. Maddala, G. S. 1983.
Limited-Dependent and Qualitative Variables in Economics. New York. Cambridge
University Press. 401 p.
37. Maggi, G.; Mrázová,
M.; Neary, J. P. 2021. Choked by red tape? The
political economy of wasteful trade barriers. International Economic Review.
63(1): 161-188. doi:
https://doi.org/10.1111/iere.12533.
38. Mangelsdorf, A.;
Portugal-Perez, A; Wilson, J. 2012. Food Standards and Exports: Evidence from
China. World Bank Policy Research Working Paper 5976. Washington D.C. World
Bank. 25 p.
39. Melo, O.; Engler, A.;
Nahuelhual, L.; Cofré, G; Barrena, J. 2014. Do Sanitary, Phytosanitary, and
Quality-related Standards Affect International Trade? Evidence from Chilean
Fruit Exports. World Development. 54: 350-359. doi:
https://doi.org/10.1016/j.worlddev.2013.10.005
40. Mendonça Lima, D.;
Ramos de Oliveira, A. L. 2021. Waste assessment in distribution and marketing
logistics of horticultural products: evidence from Brazil. Revista de la Facultad de
Ciencias Agrarias .
Universidad Nacional de Cuyo. Mendoza. Argentina. 53(1): 207-219.
41. Mimouni, D.; Averbeck,
C.; Skorobogatova, O. 2009. Obstacles to Trade from the Perspective of the
Business Sector: A Cross-Country Comparison. In: Lawrence, R.; Drezeniek, M.;
Moavenzadeh, J. (Eds.). The Global Enabling Trade Report 2009. Geneva. World
Economic Forum. 69-76.
42. Munasib, A.; Roy, D.
2013. Non-tariff barriers as a bridge to cross. In The 2013 AAEA & CAES
Joint Annual Meeting. Washington D. C. Agricultural and Applied Economics Association. 36 p.
43. Murina, M.; Nicita, A.
2017. Trading with Conditions: The Effect of Sanitary and Phytosanitary
Measures on the Agricultural Exports from Low-income Countries. The World
Economy. 40(1): 168-181. doi:
https://doi.org/10.1111/twec.12368
44. Orefice, G. 2017.
Non-Tariff Measures, Specific Trade Concerns and Tariff Reduction. The World
Economy. 40(9): 1807-1835. doi:
https://doi.org/10.1111/twec.12447
45. Penello, D. 2014.
Study of average effects of non-tariff measures on trade imports. UNCTAD Policy
Issues in International Trade and Commodities Research Study Series No. 66. New
York and Geneva. United Nations Publications. 20 p.
46. Santos Silva, J.;
Tenreyro, S. 2006. The Log of Gravity. The Review of Economics and Statistics.
88(4): 641-658. doi:
https://doi.org/10.1162/rest.88.4.641
47. Santos Silva, J.;
Tenreyro, S. 2011. Further simulation evidence on the performance of the
Poisson pseudo-maximum likelihood estimator. Economic Letters. 112: 220-222. doi: https://doi. org/10.1016/j.econlet.2011.05.008
48. Taghouti, I.;
Martínez-Gómez, V.; Marti, L. 2016. Sanitary and Phytosanitary measures in
agri-food imports from the European Union: Reputation effects over time.
Economía Agraria y Recursos Naturales. 16(2): 69-88.
49. Tao, H.; Luckstead,
J.; Zhao, L.; Xie, C. 2016. Estimating Restrictiveness of SPS Measures for
China’s Dairy Imports. International Food and Agribusiness Management Review.
19(B): 101-124. doi:
https://doi.org/10.22004/ag.econ.244619
50. Tinbergen, J. 1962.
Shaping the World Economy. New York. Twentieth Century Fund. 330 p.
51. Tiu, C. 2021.
Pesticide Residues in Food: A Never-Ending Challenge. In: Scott, P.; Strange,
R.; Korsten, L.; Gullino, M. L. (Eds.). Plant Diseases and Food Security in the
21st Century. Switzerland.
Springer. 251-258.
52. UNCTAD. 2010.
Non-tariff measures: Evidence from Selected Developing Countries and Future
Research Agenda. Geneva, Switzerland. United Nations Publications. 144 p.
53. UNCTAD. 2015.
International classification on Non-Tariff Measures. Geneva, Switzerland.
United Nations Publications. 48 p.
54. Van, T. V; Lv, J. H. ; Vu, T. T. H; Ngo, V. Q. 2020. Contradictory impact of
the natural forest closing policy and sanitary-phytosanitary measures on the
export of non-timber forest products: a case study of Vietnam. Canadian Journal
of Forest Research. 51(1): 49-58. doi:
https://doi.org/10.1139/cjfr-2020-0106
55. Wongmonta, S. 2021.
Evaluating the impact of sanitary and phytosanitary measures on agricultural
trade: evidence from Thai fruit exports to China. The Singapore Economic
Review. 66(3): 1-19. https://doi.org/10.1142/S021759082150017X
56. Wood, J.; Wu, J.; Li,
Y.; Kim, J. 2017. TBT and SPS impacts on Korean exports to China: empirical
analysis using the PPML method. Asian-Pacific Economic Literature. 31(2):
96-114. doi: https://doi.org/10.1111/apel.12186
57. Wood, J.; Wu, J.; Li,
Y.; Kim, J. 2019. The Impact of TBT and SPS Measures on Japanese and Korean
Exports to China. Sustainability. 11(21): 6141.
https://doi.org/10.3390/su11216141
58. World Bank. 2008. A
Survey of Non-Tariff Measures in the East Asia and Pacific Region. The World
Bank Policy Research Report No. 42853. The World Bank. 223 p.
59. WTO. 2015. The WTO Agreement on the Application of Sanitary
and Phytosanitary Measures (SPS Agreement). https://www.wto.org/english/tratop_e/sps_e/spsagr_e.htm . (Accessed: May 2022).
60. Xiong, B.; Beghin, J. 2017.
Chapter 6: Disentangling demand-enhancing and trade-cost effects of maximum
residue regulations. In: Beghin, J. (Ed.). Non-tariff Measures and
International Trade. 392 p. World Scientific. Singapore. 105-108.