Revista de la Facultad de Ciencias
Agrarias. Universidad Nacional de Cuyo. Tomo 54(2). ISSN (en línea) 1853-8665.
Año 2022.
Original article
Management improvement of the supply chain of perishable
agricultural products by combining the Scor model and AHP methodology.
The ecuadorian flower industry as a case
study
Mejorar la gestión de la cadena de suministro de
productos perecederos agrícolas combinando el modelo Scor y la metodología AHP.
La industria floral ecuatoriana como caso de estudio
Luis
Rodríguez-Mañay 1
Inmaculada Guaita-Pradas 2
1 Universidad Central del Ecuador. Facultad de Ciencias
Administrativas. Quito 170129. Ecuador.
2
Universidad Politécnica de Valencia. Facultad de Administración y Dirección de
Empresas. Departamento de Economía y Ciencias Sociales. 46022 Valencia.
España.
* imarques@esp.upv.es
Abstract
This research
aims to identify and propose an analysis and redesign methodology for Supply
Chain (SC) processes, leading to better performance and financial results. Our
study focuses on the Ecuadorian flower industry redesigning processes and
allowing higher levels of competitiveness. The methodology here proposed
combines the SCOR (Supply Chain Operation Reference) and a Multi-Criteria
Evaluation methodology, the Analytic Hierarchy Process (AHP). The SCOR model
allows mapping and describing the supply chain. By consulting with experts, the
AHP helps examine and select decisive chain operational aspects for successful
performance allowing redesign. According to the proposed methodology and expert
consultation, those metrics, attributes, and processes with lower weight,
should be improved. Although few research articles have applied the SCOR and
AHP models to the agricultural sector, this study on the supply chain of the
Ecuadorian floriculture sector leads us to conclude that model combination is a
suitable methodology for supply chain analysis of any perishable product and,
more specifically, the flower industry.
Keywords: AHP; SCOR; Supply chain; Agri-food
management.
Resumen
Esta investigación tiene como objetivo identificar y proponer una
metodología para analizar y rediseñar los procesos de la Cadena de Suministro
(CS), lo que conduce a un mejor rendimiento y, por tanto, a mejores resultados
financieros. Nuestro estudio se centra en la industria ecuatoriana de las
flores para impulsar el rediseño de estos procesos que le permitan alcanzar
mayores niveles de competitividad. La metodología aquí propuesta combina el
SCOR (Supply Chain Operation Reference) y una metodología de Evaluación
Multicriterio, Analytic Hierarchy Process (AHP). El modelo SCOR permite mapear
y describir la cadena de suministro y, mediante la consulta a expertos, el AHP
ayuda a examinar y seleccionar aquellos aspectos operativos de la cadena que
son decisivos para su buen funcionamiento y que, por tanto, deben ser
rediseñados. De acuerdo con la metodología propuesta y la consulta a los
expertos, deben mejorarse aquellas métricas, atributos y procesos que
obtuvieron una menor ponderación. Aunque son pocos los artículos de
investigación que han aplicado los modelos SCOR y AHP al sector agrícola, este
estudio sobre la cadena de suministro del sector florícola ecuatoriano nos
lleva a concluir que la combinación de ambos es una metodología adecuada para
analizar la cadena de suministro de cualquier sector de productos perecederos y
más concretamente la cadena de suministro de flores.
Palabras
clave: AHP; SCOR; Cadena de suministro; Gestión agroalimentaria.
Originales: Recepción: 13/05/2022
Aceptación:
14/11/2022
Introduction
Given that
flowers are perishable and temperature-sensitive products, using a cold supply
chain (SC) is imperative for avoiding financial losses (7,
19). In cut flower production, supply chain management is key for
business design (19, 30). In this
sense, optimization levels and SC best practices in the flower industry need to
improve production efficiency and distribution.
The supply
chain management (SCM) concept coordinates the different corporate partners,
internal departments, processes, and customers along a supply chain (6, 31). Supply chain integration allows gaining
competitive advantages through SCM, involving internal integration through
effectively exchanging information with customers and suppliers. By achieving
integration, the SC functions as one single unit directly driven by customer
demand (12, 18, 26). In this sense, several models have been developed to measure SC
performance, and the SCOR model stands as a powerful tool to evaluate SC’s
activities and performance, optimizing production, distribution, and sales
processes (1, 17).
The SCOR model
was developed by the Supply Chain Council (SCC) in 1996 with the intention of
understanding, describing, and assessing supply chains. This model provided a
general framework, as well as standard terminology, common metrics, and best
practices (22, 34). The SCOR
model follows a hierarchical structure with different levels in the supply
chain and a basic structure comprising three levels. This model may help
understand a particular supply chain by mapping it in terms of the business
processes (22, 29, 34). After selecting the appropriate process type, the configuration
that best fits the supply chain is finally chosen. Application complexity
depends on the type of product, demand, data reliability, and geographical
distribution of both customers and suppliers (9, 39).
The
multicriteria methodology Analytic Hierarchy Process (AHP) structures complex
decisions into hierarchies, translating goals into measurable criteria and
sub-criteria, which, in turn, can lead to alternative decisions. It assigns
priority to each hierarchy level. Alternative priorities are then compared with
those of the criteria determining alternative final importance (4, 5, 33).
Saaty and Vargas (2012) suggested that each group
member makes individual pairwise comparisons and preference judgments about the
alternatives, establishing group priorities. Thus, the individual preference
geometric means allow calculating a preference matrix establishing group
priorities (27). The combination of AHP (33)
and the SCOR model, together with experts in the field, could accurately
determine the most important processes of the SC given the specific product and
company, establishing process efficiency.
Our study tests
both SCOR and AHP models to analyze the SC of the flower industry, identifying
those processes to be redesigned, achieving higher levels of competitiveness.
Regarding the Ecuadorian flower industry and given the shortcomings in
competitiveness and logistics performance, we decided to apply the study to the
Ecuadorian flower sector, as a case study.
With an
encompassing purpose of research at sector level, Ecuadorian companies and
organizations related to flower production and market were considered. In this
regard, various authors have already studied the floriculture sector SC. Villagrán et al. (2021) designed the structure of
the supply chain management for the Colombian flower sector. Verdouw
et al. (2013) explored the virtualization of the floriculture supply
chain in the Netherlands and Janssen et al. (2016)
focused on collaboration in the Dutch flower sector supply chain. Meanwhile,
the African floriculture supply chain was examined by Button
(2020), and recently, Karpun et al. (2020) developed
a conceptual model for flower supply chain management.
Flowers are the
fourth export product in Ecuador, after oil, bananas, and shrimp. From 2014 to
2018, exports of cut flowers to different destinations reached an average value
of about USD 800 million. However, few studies approach supply
chain analysis (Mendonza Lima et al., 2021 and Tagarakis et al., 2021). These authors suggested
introducing a traceability system optimizing time, money, personnel, internal
communication and, of course, guaranteeing flower quality. According to Herrera-Granda et al. (2020), implementing the SCOR
model in the production process of flower companies would improve end-costumer
services.
Our research
intends to benefit different areas: Economically, this study will enable the
human, material, and technological resources to be optimized and controlled.
Concerning supply technology, our study may assist in the creation of a
process/ performance monitoring application. Consequently, this knowledge will
allow for a more efficient activity, leading to a more significant market share
in the European Union, which is currently at 4%. In the case of Ecuador, the
methodology proposed could also be applied to other major sectors of the
Ecuadorian economy, such as the shrimp and banana sectors.
Materials
and methods
Supply
Chain Operations Reference (SCOR)
The SCOR model
structure and the interrelationship among processes were confirmed by Zhou et al. (2011). The performance attributes
serve to define generic supply chain characteristics and to describe the supply
chain strategy. The SCOR model metrics are organized around the performance
attributes and have different hierarchical levels, in the same way as SCOR
processes (22, 34, 41).
Given that when
establishing the relevant processes, only those belonging to levels 1 and 2 of
the SCOR model are used, our analysis uses only level 1 performance attributes
and metrics for selecting the target process (22, 34).
Analytic
Hierarchy Process (AHP)
The
pairwise comparisons are made per hierarchy levels, and each stakeholder must
compare and decide which factor is more important for each level, according to
the Saaty scale (33) From
these comparisons, positive reciprocal matrices are obtained. A Saaty matrix (Equation 1) is then created for each of the decision-makers, Ak,
where aij is the result of the
comparison between factor i and factor j of the hierarchy:
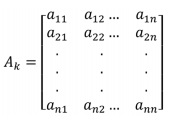 (1)
(1)
Using the
matrices with the individual preferences, the priorities of each stakeholder
are calculated (Equation 2) according to the different levels
and following the eigenvector method (EM): weights vector is the eigenvector
corresponding to the maximum eigenvalue of matrix A.
![]() (2)
(2)
where
A = the
preference matrix
W = the vector of
priority or vector of weights
ƛ max= the maximum
eigenvalue of the matrix.
Prioritization
results can be seen in the following equation:
![]() (3)
(3)
However,
not all the comparison matrices can be included in the results. Firstly,
preference consistency expressed by each decision maker is verified to confirm
valid individual opinions for group priorities. This consistency can be checked
through a consistency analysis, calculating the Saaty consistency index (CI)
for each preference matrix (Equation 4).
![]() (4)
(4)
The consistency ratio (CR) is
calculated from CI and is defined as the CI to RI ratio:
![]() (5)
(5)
where
RI = the mean CI
value of the pairwise comparisons of randomly obtained matrices of the same
order. For CR under 10% (0.1), the matrix is considered consistent.
Our analysis of the flower
industry supply chain intends to identify the SC processes to be improved or
redesigned according to performance attributes and the metrics used to measure
each attribute. Figure 1
shows the level selection of the “to be redesigned processes”.
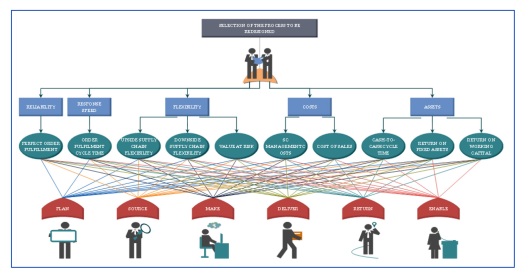
Source: Authors’, based on a proposal by
Palma-Mendoza (2014).
Fuente: Elaboración propia, basado en la propuesta de
Palma-Mendoza (2014).
Figure 1: SCOR model mapping for redesigning processes.
Figura 1: Mapeo del modelo SCOR para el rediseño de los
procesos.
On the
second level, performance attributes, followed by metrics for each attribute,
and finally, on the lowest level, the model supply chain processes.
Finally,
through the AHP analysis, each factor in the hierarchy is weighed. and the order of importance already established by the
experts are clearly visualized. This makes it possible to identify those
attributes, metrics, or processes that may initially have been less considered
but, according to expert opinion, should receive greater attention.
Data on
stakeholder preferences can be gathered through an online survey, using a
specific digital questionnaire designed for this purpose. The questionnaire
should be user-friendly and facilitate reflection and decision-making. Content,
structure, and design are essential components, and the respondent should be
able to answer individually and share his or her personal experience. Besides
the questions, it should also include descriptions of decision-making in the
floriculture sector, the AHP hierarchy, the Saaty scale, and how to make
pairwise comparisons. Stakeholders are invited to share their expert opinion
through the online survey (23).
Case
study
Flower
production in the Ecuadorian Pichincha and Cotopaxi provinces account for 83%
of the production, with the largest number of flower companies. This study
gathered, a group of experts in the flower industry representing the largest
100 Ecuadorian flower companies (order established based on the income data
published by the Superintendencia de Compañías del Ecuador), accounting for
approximately 80% of the industry’s turnover in 2019 (2, 8). The group was also integrated by academics
from the Facultad de Administración de Empresas de la Universidad Central del
Ecuador; government experts in floriculture from the municipality of Cayambe;
and flower quality control specialists. All participants were given equal
importance in the decision-making process (24).
A digital
questionnaire gathered information on stakeholder preferences (https://docs.google.com/forms/d/1YzlailVXXF0xk4tURIM3v1GweL2oINS3RMh_WdG-7Q/edit?usp=drive_web).
The
questionnaire was divided into four sections:
- The first
section described objectives and requested information on company or
institution identity. It also included information on the Ecuadorian flower
sector, the Ecuadorian supply chain and the AHP hierarchy with the objective of
redesigning elements, metrics, and processes. Finally, it added an explanation
of the Saaty scale for comparisons.
- The second
section listed 10 questions related to pairwise comparisons of the supply chain
processes for rank determination.
- The third
section presented questions regarding metrics for each attribute (7 questions).
- Finally, the
fourth section included 10 questions about performance metrics relevance.
Results
and discussion
Several authors
have applied this approach. Specifically, in their study into the Turkish
clothing industry, Aydın et al. (2014) used the
SCOR levels as follows: Level 1 described model scope and content, and in level
2, the company’s supply chain was broken down into 26 process categories. The
scope of the research focused on level 1 performance attributes and metrics.
Meanwhile, Lhassan et al. (2018) considered
level 1 as the strategic level at which the different supply chain processes
and the role of the SC actors were defined. Among the
actors considered were manufacturers, suppliers, wholesale distributors, and
first and second-level customers. The distributing processes identified were
plan, source, delivery, and return. At level 2, considered the tactical level,
each level 1 process was broken down into two or more sub-processes. The
questionnaire was sent to ninety-six companies, but only six answered with
Hilsea Investments first in the ranking by income. In addition, answers were
received from two academics, a local council official from Cayambe, and an
expert in flower quality control for the Ecuadorian flower sector. A total of
ten out of 100 submissions were answered.
The different stakeholder
assessments showed coherence as well as acceptable consistency. Table 1, presents level 1 weightings of the Ecuadorian flower
supply chain.
Table 1: Level 1 metrics weights.
Tabla 1: Pesos para las métricas de nivel 1.
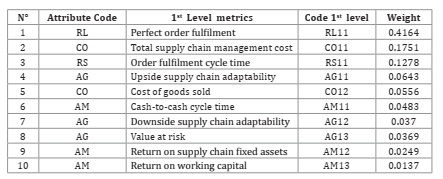
Source: Author calculations. *Attribute: Reliability (RL),
Responsiveness (RS), Agility (AG), Cost (CO), Asset Management Efficiency (AM).
Fuente: Elaboración propia. *Atributos: Fiabilidad (F),
Velocidad de respuesta (VR), Agilidad (AG), Coste (CO), Eficiencia en la
gestión de activos (E).
Regarding the
ten metrics proposed by the SCOR model, the results show that stakeholders
considered the Perfect order fulfilment metric to be the most relevant,
weighing 40%. Other significant metrics, albeit of less importance, are SC
management cost, with 18%, and Order fulfilment cycle time, with almost 13%.
The other seven metrics, only accounting for 29%, were considered unimportant
by the experts. In decreasing order, these seven metrics are: Upside supply
chain adaptability, Cost of goods sold, Cash-to-cash cycle time, Downside
supply chain adaptability, Value at risk, Return on supply chain fixed assets,
and Return on working capital.
Concerning the
Upside supply chain adaptability metric, with 6% weight, the maximum period
(for a company to adapt) suggested by the SCOR model, is 30 days. But in the
case of the flower industry, this would be unfeasible, since depending on the
species, it takes approximately twenty weeks for flowers to reach harvest time (11, 13,
22, 34) and,
therefore, any adjustment would need more time. The fact that the flower
industry has a limited capacity to quickly react to changes in demand may well
be the reason for the low weight given to this metric. However, considering the
outlook for the flower industry, it does seem that the Ecuadorian floriculture
sector should pay greater attention to this SCOR supply chain metric. This is
given the growing demand already observed during the first months of 2021 (5%
increase as compared to the same period in 2020) (37), and also increasing exports predicted by
the International Association of Horticultural Producers (AIHP). This
organization estimates that flower demand in China will reach EUR 100 billion
by 2030 (10).
In 2019 goods
sold in the flower industry accounted for approximately 99% of the sales, one
point higher than in previous years, whose average was 98% (2, 8). These percentages leave companies very
little room for manoeuvre when it comes to establishing new markets or pricing
strategies. This would explain the weight given to this metric (5.6%), which
ranked fifth among the ten metrics studied. Despite the apparent need to
optimize processes and production costs in the Ecuadorian flower sector, to our
knowledge, there is no state-of-the-art research on this issue.
The experts
participating in this study attached little importance to the Cash-to-cash
cycle time metric, with a weight of less than 5%, ranking sixth. However, if
this metric were better managed, flower companies could obtain annual
surpluses, enabling them to invest further and improve their yield and
production management. Based on the financial statements of some of the
companies (2, 8), we estimated
the cash-to-cash time cycle length at about 42 days. This is because the sum of
the days of accounts receivable plus the days of inventory generates a
relationship of 3 to 1 with the days of accounts payable. The average
collection period was estimated at approximately 44 days. If this number of
days were to be reduced to thirty, firms could then produce an annual surplus
of up to USD 1,500,000 that could be invested in other asset types.
The SCOR
model suggests 30 days for the Downside supply chain adaptability metric.
As in the case of the Upside supply chain adaptability metric, the
flower production system itself makes it challenging to meet these deadlines
since the process cannot be suspended at short notice. Thus,
the fact that this metric is difficult to manage and control may be the reason
why it stands seventh with little attached importance.
The Value
at-risk metric ranks eighth and is considered by floriculture organizations as
part of the risk management function and not as a risk quantifying metric (32). Uncertainty is obviously inherent to the
flower industry, making it extremely complicated for companies to forecast
risks. From the flower companies’ financial statements (published by the
Superintendencia de Compañías del Ecuador), it was
estimated that industry yield risk was about 44% in the 2015-2019 period (Expected
return, R ̅; standard deviation, σ; coefficient of variation, CV;
CV= σ⁄R ̅). This clearly indicates high risk, given that in the
Ecuadorian floriculture sector, as previously mentioned, yield with respect to
income is about 1%.
The Return on
supply chain fixed assets metric (21) barely represents 2% of the total weight.
This low percentage is due to the reduced margin of these flower companies,
which in turn is related to the supply chain assets, and as previously stated,
the high cost of sales leaves these firms little room for manoeuvre.
Finally, the
Return on working capital metric (36) ranks last in level 1. The metric value
calculated from the aforementioned financial statements data (Superintendencia
de Compañías del Ecuador) was 10% (Return of working capital=(Revenue-Costs)/
(Inventory+Accounts receivable-Accounts payable). This value is obtained after
considering: (a) that the ratio between accounts receivable and inventory to
the payable accounts is 3 to 1, and (b) given the reduced margin (1%) from the
revenue minus total costs.
Table 2 offers both the calculated and the suggested performance
weights of the Ecuadorian flower industry supply chain.
Table
2: Calculated vs. suggested
weights for the performance attributes.
Tabla 2: Pesos calculados vs. sugeridos para los atributos de desempeño.
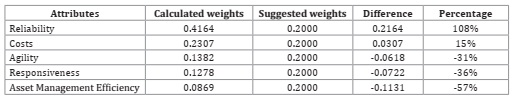
Source: Author calculations. * Calculated weight of the attributes
- Suggested attribute weight = Difference = Gap.
Fuente: Cálculo de los autores * Peso calculado de los
atributos - Peso sugerido de los atributos = Diferencia = Brecha.
Attributes with
the largest gaps can be found in reliability, effective SC asset management,
response speed, and flexibility.
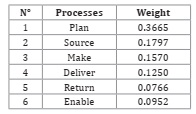
Table 3 displays weights attributed to the six main supply chain
processes (Plan, Source, Make, Deliver, Return and Enable).
Tabla 3: Pesos de los procesos.
Source: Author calculations.
Fuente: Elaboración propia.
These
results show that the return and enable processes have the lowest scores, and
should, in consequence, be more attentively observed. The return process is
carried out by the flower companies themselves, but not following SCOR
recommendations. In fact, the participating Ecuadorian flower companies did not
specify protocols in relation to product reverse flow, nor did they indicate
any aspects associated with return delivery scheduling, shipment and reception,
all of which should be considered in the return process according to the SCOR
model.
The enabling
process showed the lowest weight, meaning no activity related to the SC
management is carried out as recommended by SCOR. This implies no monitoring of
trade rules, performance, data processing, resources, facilities, contracts,
network supply chain, rule compliance, risks, or procurement.
Conclusions
We conclude
that using both the SCOR model and AHP may not only constitute an appropriate
methodology supply chain analysis of the floriculture sector but may also be
applied to any other producing sector. To date, few research articles have
combined the application of the SCOR and AHP methods to the agricultural
sector.
The SCOR model
permits to map and describe the supply chain, and along with experts and the
AHP technique, identify and redesign those crucial chain aspects.
Performance
attributes and metrics of the SCOR model cover all possible metric combinations
measuring supply chain performance. Best practices recommended by SCOR apply to
any supply chain structure.
In this study,
level 1 metrics, SCOR attributes and all processes defined, were analyzed
through surveys. Based on the pairwise comparisons in AHP, experts identified
the most critical performance aspects needing to be redesigned.
According to
the results obtained, improvements should focus on those lower-weighted aspects
by applying the best SCOR practices. Concerning metrics, those to be improved
are increasing and decreasing the supply chain adaptability, cost of sold
goods, cash-to-cash cycle time, value at risk, return on supply chain fixed
assets, and return on working capital. As for the attributes, the following
need to be upgraded: reliability, supply chain asset management,
responsiveness, and agility. Finally, regarding the processes, adjustments
should focus on the return and enable (management) processes.
It is suggested
that representatives of the Ecuadorian flower industry adopt the following
measures: (a) continuous monitoring of demand behaviour, (b) reduction in the
cost of sales share with respect to income, (c) reduction in number of days of
receivable accounts and inventory, (d) risks monitoring risk management tools
usage, (e) fixed assets usage optimization, and (f) reverse logistics
application.
Several
Ecuadorian flower companies took part in our study. But the participation of
the flower export trade association as a whole, together with a larger number
of Ecuadorian flower companies, could help obtain a more complete picture in
future studies. Furthermore applying other approaches, such as business process
reengineering (BPR) could help redesign processes.
Acknowledgements
This
research did not receive any specific grants from funding agencies in the
public, commercial, or non-for-profit sectors. The authors acknowledge the
reviewers of the manuscript whose comments contributed greatly to the
improvement of this paper.
1. Angón, E.; Bragulat, T.; García, A.; Giorgis, A.; Perea, J.
2021. Key factors affecting the technical efficiency of bee farms in the
province of La Pampa (Argentina): A two-stage DEA approach. Revista de la Facultad de Ciencias Agrarias. Universidad Nacional de Cuyo. Mendoza.
Argentina. 53(1): 150-163.
2. Araque Jaramillo, W.; Hidalgo Flor, R.; Rivera Vásquez, J.
2022. Small and medium-sized enterprises in Ecuador: Evolution and
Challenges. Journal of Evolutionary Studies in Business.
7(1): 121-165. https://doi.org/10.1344/jesb2022.1.j101
3. Aydın, S. D.; Eryuruk, S. H.; Kalaoglu, F. 2014. Evaluation of
the performance attributes of retailers using the Scor Model and AHP: A case
study in the Turkish Clothing Industry. Fibres & Textiles
in Eastern Europe. 22(5): 14-19. https://doi.org/ISSN: 1230-3666
4. Ayyildiz, E.; Gumus, A. 2021. Interval valued pythagorean fuzzy
AHP method based supply chain performance evaluation by a new extension of SCOR
model: SCOR 4.0. Complex & Intelligent Systems.
7(1): 559-576. https://doi.org/https://doi.org/10.1007/s40747-020-00221-9
5. Bigaran Aliotte, J. T.; Ramos de Oliveira, A. L. 2022. Multicriteria
decision analysis for fruits and vegetables routes based on the food miles
concept. Revista de la Facultad de Ciencias Agrarias . Universidad
Nacional de Cuyo. Mendoza. Argentina. 54(1): 97-108.
6. Bronzo, M.; de Oliveira, M. P. V.; McCormack, K. 2012. Planning,
capabilities, and performance: An integrated value approach. Management
Decision. 50(6): 1001-1021. https://doi. org/10.1108/00251741211238300
7. Button, K. 2020. The economics of Africa’s floriculture
air-cargo supply chain. Journal of Transport Geography.
86(102789): 1-10.
https://doi.org/10.1016/j.jtrangeo.2020.102789
8. Carvache-Franco, O.; Carvache-Franco, M.; Carvache-Franco, W.
2022. Barriers to Innovations and Innovative Performance of Companies: A Study
from Ecuador. Social Sciences. 11(2).
https://doi.org/10.3390/socsci11020063
9. de Andrade Dutra Filho, j.; Silva Souto, L.; Gil de Luna, R.;
dos Santos Souza, A.; Gomes-Silva, F.; Cavalcante Silva, F. A.; Simões Neto, D.
E.; Calsa Júnior, T. 2021. Mixed modeling for fiber yield genetic selection in
sugarcane (Saccharum officinarum). Revista
de la Facultad de Ciencias Agrarias .
Universidad Nacional de Cuyo. Mendoza. Argentina. 53(2): 11-19.
10. Deng, X.; Hao, Y.; Yu, J.; Zhang, Q.; Liu, Z. 2021. Highlights of the special issue on Horticulture research for green
and sustainable development. Frontier Agriculture
Science Engineering. 8(2): 193-195.
11. Détár, E.; Zámbori-Németh; Gosztola, B.; Harmath, A.; Ladányi,
M.; Pluhár, Z. 2021. Ontogenesis and harvest time are crucial for high quality
lavender - Role of the flower development in essential oil properties. Industrial Crops and Products. 163(113334).
https://doi. org/10.1016/j.indcrop.2021.113334
12. Giacinti Battistuzzi, M. Á.; Pires Manso, J. R.; Valenciano,
J. de P. 2020. Determination of the price in the fresh fruit market: case of
pears. Revista de la Facultad de Ciencias Agrarias . Universidad
Nacional de Cuyo. Mendoza. Argentina. 52(1): 225-232.
13. Ha, S. T. T.; Nguyen, T. K.; Lim, J. H. 2021. Effects of
air-exposure time on water relations, longevity, and aquaporin-related gene
expression of cut roses. Horticulture, environment, and
biotechnology. 62(1): 63-75. https://doi.org/10.1007/s13580-020-00302-1
14. Herrera-Granda, I. D.; Lorente-Leyva, L. L.; Peluffo-Ordóñez,
D. H.; Alemany, M. M. E. 2020. A forecasting model to predict
the demand of roses in an Ecuadorian small business under uncertain scenarios.
In Lecture Notes in Computer Science (including subseries Lecture Notes in
Artificial Intelligence and Lecture Notes in Bioinformatics). Vol. 12566 LNCS. Springer International
Publishing. https://doi.org/10.1007/978-3-030-64580-9_21
15. Janssen, G. R.; de Man, A. P.; Quak, H. J. 2016. The role of fairness in governing supply chain collaborations-a
case-study in the Dutch floriculture industry. Logistics and Supply
Chain Innovation: Bridging the Gap between Theory and Practice. 141-157. https://doi. org/10.1007/978-3-319-22288-2_9
16. Karpun, O. V. 2020. Conceptual model of floriculture supply
chain management. Intellectualization of Logistics and Supply
Chain Management. 4. https://doi.org/10.46783/smartscm/2020-4
17. Khakpour, Al.; Colomo-Palacios, R.; Martini, A. 2021. Visual
analytics for decision support a supply chain perspective. IEEE Access. 9:
81326-81344.
18. Khanuja, A.; Jain, R. K. 2019. Supply chain integration: a
review of enablers, dimensions and performance. Benchmarking:
An International Journal. 27(1): 264-301. https://doi.
org/10.1108/BIJ-07-2018-0217
19. Kyriacou, M. C.; Rouphael, Y. 2018. Towards
a new definition of quality for fresh fruits and vegetables. Scientia
Horticulturae, 234(October 2017). 463-469.
https://doi.org/10.1016/j.scienta.2017.09.046
20. Lhassan, E.; Ali, R.; Majda, F. 2018. Combining SCOR and BPMN
to support supply chain decision making of the pharmaceutical
wholesaler-distributors. In 2018 4th International
Conference on Logistics Operations Management. 1-10.
21. Longinidis, P.; Georgiadis, M. C. 2014. Integration
of sale and leaseback in the optimal design of supply chain networks. Omega (United Kingdom). 47: 73-89.
https://doi.org/10.1016/j.omega.2013.08.004
22. Majumder, D.; Bhattacharjee, R.; Dam, M. 2020. Fuzzy supply chain performance measurement model based on SCOR
12.0. In Advances in Intelligent Systems and Computing
(Vol. 1125). Springer Singapore.
https://doi.org/10.1007/978-981-15-2780-7_116
23. Marques-Perez, I.; Segura, B. 2018. Integrating
social preferences analysis for multifunctional peri-urban farming in planning.
An application by multi-criteria analysis techniques and
stakeholders. Agroecology and Sustainable Food
Systems. 42(9): 1029-1057. https://doi.
org/10.1080/21683565.2018.1468379
24. Marques-Perez, I.; Guaita-Pradas, I.; Gallego, A.; Segura, B.
2020. Territorial planning for photovoltaic power plants
using an outranking approach and GIS. Journal of
Cleaner Production, 257, 120602. https://doi.org/10.1016/j.jclepro.2020.120602
25. Mendonça Lima, D.; Ramos de Oliveira, A. L. 2021. Waste
assessment in distribution and marketing logistics of horticultural products:
evidence from Brazil. Revista de la Facultad de Ciencias Agrarias . Universidad Nacional
de Cuyo. Mendoza. Argentina. 53(1): 207-219.
26. Naesens, K.; Gelders, L.; Pintelon, L. 2007. A swift response
tool for measuring the strategic fit for resource pooling: A case study. Management Decision. 45(3): 434-449. https://doi.
org/10.1108/00251740710745061
27. Ossadnik, W.; Schinke, S.; Kaspar, R. H. 2016. Group
aggregation techniques for analytic hierarchy process and analytic network
process: A comparative analysis. Group decision and
negotiation. 25(2): 421-457. https://doi.org/10.1007/s10726-015-9448-4
28. Palma-Mendoza, J. A. 2014. Analytical hierarchy process and
SCOR model to support supply chain re-design. International
Journal of Information Management. 34(5): 634-638. https://doi.
org/10.1016/j.ijinfomgt.2014.06.002
29. Phadi, N. P.; Das, S. 2021. The Rise and Fall
of the SCOR Model: What after the pandemic? In modeling and
optimization in science and technologies (Vol. 18). Springer
International Publishing. https://doi.org/10.1007/978-3-030-72929-5_12
30. Porat, R.; Lichter, A.; Terry, L. A.; Harker, R.; Buzby, J.
2018. Postharvest losses of fruit and vegetables during retail and in
consumers’ homes: Quantifications, causes, and means of prevention. Postharvest
Biology and Technology, 139(November 2017). 135-149. https://
doi.org/10.1016/j.postharvbio.2017.11.019
31. Queiroz, M. M.; Telles, R.; Bonilla, S. H. 2019. Blockchain
and supply chain management integration: a systematic review of the literature.
Supply Chain Management: An International Journal. 25(2): 241-254.
https://doi.org/10.1108/SCM-03-2018-0143
32. Rotaru, K.; Wilkin, C.; Ceglowski, A. 2014. Analysis
of SCOR’s approach to supply chain risk management. International
Journal of Operations and Production Management. 34(10): 1246-1268.
https://doi.org/10.1108/IJOPM-09-2012-0385
33. Saaty, T.; Vargas, L. 2012. Models, methods,
concepts & applications of the analytic hierarchy process. In International Series in Operations Research & Management
Science (Vol 2). https://doi.org/10.1007/978-1-4614-3597-6
34. Sholeh, M. N.; Nurdiana, A.; Dharmo, B.; Suharjono. 2021.
Implementation of construction supply chain flow based on SCOR 12.0 performance
standards. Journal of Physics: Conference Series. 1833(1): 0-7.
https://doi.org/10.1088/1742-6596/1833/1/012012
35. Tagarakis, A. C.; Benos, L.; Kateris, D.; Tsotsolas, N.;
Bochtis, D. 2021. Bridging the gaps in traceability systems
for fresh produce supply chains: Overview and development of an integrated
iot-based system. Applied Sciences (Switzerland).
11(16). https://doi.org/10.3390/app11167596
36. Tang, D.; Zhuang, X. 2020. Financing a capital-constrained
supply chain: factoring accounts receivable vs a BCT-SCF receivable chain. Kybernetes, 71671030. https://doi.
org/10.1108/K-06-2020-0367
37. van Heck, E. 2021. Technology Meets Flowers. In Technology
Meets Flowers. https://doi. org/10.1007/978-3-030-69303-9
38. Verdouw, C. N.; Beulens, A. J. M.; Trienekens, J. H.; Van Der
Vorst, J. G. A. J. 2011. A framework for modelling business processes in
demand-driven supply chains. Production Planning and Control.
22(4): 365-388. https://doi.org/10.1080/09537287.2010.486384
39. Verdouw, C.; Beulens, A. J.; Van der Vorst, J. G. A. J. 2013.
Virtualisation of floricultural supply chains: A review from an Internet of
Things perspective. Computers and Electronics in Agriculture.
99: 160-175. https://doi.org/https://doi.org/10.1016/j.compag.2013.09.006
40. Villagrán, E.; Flores-Velazquez, J.; Bojacá, C.; Akrami, M.
2021. Evaluation of the microclimate in a traditional
Colombian greenhouse used for cut flower production. Agronomy
MDPi.
41. Wang, C. N.; Tsai, H. T.; Ho, T. P.; Nguyen, V. T.; Huang, Y.
F. 2020. Multi-criteria decision making (MCDM) model for supplier evaluation
and selection for oil production projects in Vietnam. Processes.
8(2). https://doi.org/10.3390/pr8020134
42. Zhou, H.; Benton, W. C. J.; Schilling, D. A.; Milligan, G. W.
2011. Supply chain integration and the SCOR model. Journal of
Business Logistics. 32(4): 332-344.