Revista de la Facultad de Ciencias
Agrarias. Universidad Nacional de Cuyo. Tomo 57(2). ISSN (en línea) 1853-8665.
Año 2025.
Original article
Temporal
Analysis of Northern Corn Leaf Blight (Exserohilum turcicum Pass.
Leonard & Suggs) Epidemics
Análisis
temporal de epidemias del tizón foliar común del maíz (causado por Exserohilum
turcicum Pass) Leonard & Suggs)
Fernando Andrés
Guerra1,
María Cristina
Plazas1,
Ezequiel Vuletic1,
Gustavo Darío
Guerra1,
Erlei Melo Reis2
1Universidad Católica de Córdoba. Avda. Armada Argentina N° 3555.
C P. X5016DHK. Córdoba. Argentina.
2Instituto Agris. Passo Fundo. Río Grande do Sul. Brasil.
*roberto.derossi@ucc.edu.ar
Abstract
Field trials were
conducted in six locations in central-northern Córdoba, Argentina, using four
maize hybrids with varying resistance to northern corn leaf blight (NCLB),
caused by Exserohilum turcicum. Naturally occurring NCLB epidemics were
evaluated. We analyzed disease severity (S%), disease progress curve (DPC),
area under the disease progress curve, final severity (FS%) and apparent
infection rate (r). Disease progress curves were simultaneously analyzed by
fitting nonlinear epidemiological models (Gompertz and Logistic). Ballesteros
and Villa María were the localities with the highest FS in susceptible hybrids
(45% and 37.5%, respectively). Levels of FS were below 5% in Jesús María, Río
Segundo and Freyre, and under 1% in El Tío. The highest AUDPC values were also
observed in Ballesteros and Villa María (2150.1 and 1335.7, respectively). In
the other locations, AUDPC values remained under 320, with statistically
significant differences in all cases (p< 0.05). The resistant hybrid
exhibited the lowest apparent infection rate compared to the other genotypes.
Epidemic progress displayed, to varying degrees, sigmoid-shaped curves
characteristic polycyclic diseases. On average, the Gompertz model best fitted
disease progress data across all evaluated genotypes with an R2
of 0.909 and
an adjusted coefficient (R2*)
of 0.849. The temporal analysis provided key epidemiological insights into the
maize-NCLB pathosystem, supporting the development of effective management
strategies.
Keywords: Zea mays,
Helminthosporium, epidemiology, AUDPC, Córdoba
Resumen
Se realizaron
ensayos de campo en seis localidades de la región centro-norte de Córdoba,
utilizando cuatro híbridos de maíz con diferentes niveles de resistencia al
tizón foliar común del maíz (TFC), causado por Exserohilum turcicum. Se
evaluaron epidemias de la enfermedad generadas de forma natural. Se analizó la
severidad (S%), la curva de progreso de enfermedad (CPE), el área bajo la curva
de progreso de la enfermedad (ABCPE), la severidad final (SF%) y tasa infección
aparente (r). Las curvas de progreso de la enfermedad se analizaron
simultáneamente según el ajuste a los modelos epidemiológicos no lineales
Logístico y de Gompertz. Ballesteros y Villa María fueron las localidades con
mayor SF en materiales susceptibles, siendo de 45% y 37,5% respectivamente. Los
niveles de SF fueron inferiores al 5% en Jesús María, Río Segundo y Freyre, y
menores al 1% en El Tío. Así mismo, las mayores ABCPE se registraron en
Ballesteros y Villa María (2150,1 y 1335,7, respectivamente). En las demás
localidades los valores de ABCPE fueron menores a 320, presentando en todos los
casos diferencias estadísticamente significativas (p<0,05). El híbrido
resistente obtuvo la menor tasa de infección aparente en comparación con los otros
genotipos. El progreso de las epidemias determinó, en mayor o menor magnitud,
curvas de formato sigmoidal típicas de enfermedades policíclicas. En promedio,
el modelo de Gompertz fue el que mejor se ajustó a los datos de progreso de la
enfermedad en todos los genotipos evaluados, con un R2 de 0,909 y un
coeficiente ajustado (R²*)
de 0,849. El análisis temporal proporcionó información epidemiológica clave
sobre el patosistema maíz - tizón foliar común, que ayuda a la implementación
de técnicas efectivas para su manejo y control.
Palabras clave: Zea mays, Helminthosporium,
epidemiología, ABCPE, Córdoba
Originales: Recepción: 22/05/2023 - Aceptación: 24/06/2025
Introduction
Corn (Zea mays L.)
is a strategic crop in Argentina. According to the final report elaborated by
the Bolsa
de Cereales de Buenos Aires (2019) for 2020-21, more than 6.6 million hectares were sown,
producing 57 million tons of grains. Average national production was 8280 kg. ha-1,
contributing over 14.8 billion USD to the country´s gross domestic product.
Among several
diseases affecting corn, northern corn leaf blight (NCLB) is highly prevalent,
with increasing incidence and severity in Argentina (8). NCLB is caused by
the fungus Exserohilum turcicum (Pass.) K. J. Leonard & Suggs
[synonym: Helminthosporium turcicum Pass.], anamorph of Setosphaeria
turcica (Luttr.) K. J. Leonard & Suggs. This disease can cause severe
yield losses under particular host-pathogen-environment interactions. Yield
reductions typically range between 15 and 50% (7,
10, 28) but may even reach 98% (18).
In general,
effective management strategies are based on epidemiological studies. Temporal
analysis of disease progress is critical for many epidemiological
investigations (23). Understanding
temporal dynamics of NCLB is essential to describe disease progression, develop
sampling plans, design controlled experiments, and asses yield losses. To date,
Argentina has scarce information on NCLB development in different corn hybrids,
and thus, we hypothesize that temporal epidemiological information can
contribute to more effective management decisions.
Temporal analysis
allows constructing disease progress curves (DPCs) representing the epidemic
process (19) and pathogen, host, and environment
interactions (31). Curve shapes and
their components, initial disease level (yo), apparent infection rate (r), final
disease level (yf),
and area under the progress disease curve (AUDPC), allow epidemic
characterization and management (3).
DPCs can be studied
using mathematical models that quantitatively describe epidemic biological
dynamics, considering parameter estimates, like Logistic, Gompertz, and
monomolecular models (23).
NCLB severity and temporal progress significantly vary among
maize hybrids with different resistance. These differences can be characterized
using nonlinear epidemiological models, under the agro-climatic conditions of
the central-northern region of Córdoba.
NCLB epidemiology
provides the basis for developing management strategies within an
agroecosystem. This study conducted a temporal analysis of NCLB epidemics by
comparing hybrids with different disease responses across multiple localities.
Materials
and Methods
Experimental
Sites, Hybrids and Experimental Design
During the
2015/2016 growing season, six field experiments were conducted across six
locations of central-northern Córdoba, Argentina (latitudes -32.519004 to
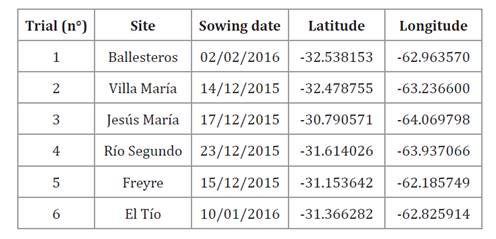
-29.432741 and longitudes -62.185749 to -64.069798) (table 1).
Table 1. Site,
sowing date, and georeferencing of trials conducted in central-northern
Córdoba, Argentina, during the 2015-16 maize season.
Tabla
1. Lugar, fecha de siembra y
georreferenciación de los ensayos establecidos en la región centro-norte de
Córdoba durante la campaña agrícola 2015-16 para maíz.
Four corn hybrids
were evaluated at each site in a randomized complete block design with four
replicates. Plots consisted of eight rows, 4 m wide and 10 m long, spaced 0.52
m. The four hybrids were KWS 4321 (susceptible, S), KWS 1516 (moderately
susceptible, MS), KWS 1529 (moderately resistant, MR), and KWS Exp20
(resistant, R). All seeds were provided by KWS Argentina corn seed company.
Sowing was
performed between December 2015 and February 2016, following soybean season.
Crop rotation scheme was corn-soybean-corn under non-tillage conditions; thus,
corn debris from the two preceding seasons remained in the fields. Seeding
rates varied by location according to yield potential, with an average of
72.000 seeds. ha-1.
Each experiment followed standard commercial agronomic practices, including
fertilization with 240 kg. ha-1 urea at sowing and 4 L.
ha-1 of liquid nitrogen at the
V4 stage. Insecticides were not required, and no fungicides were applied to
allow natural development of foliar diseases.
Field
Evaluations
Experimental plots
were established in intensively cultivated areas. NCLB epidemics developed
naturally. Initial inoculum originated from the experimental sites (infected
seeds and saprophytically infected corn residues) and airborne spores from
neighboring fields, generating primary and secondary infection cycles.
Disease severity was assessed at 30, 45, 60, 85, 100 and 120
days after sowing (DAS) in each locality. Six plants per block were randomly
selected, totaling 24 plants per hybrid at each time point. Leaf blight
severity was estimated as the ratio of affected to healthy leaf area, expressed
as a percentage, using the diagrammatic scale by Fullerton (1982). Evaluations were
performed on the four uppermost unfolded leaves during vegetative stages and on
the ear leaf (el), plus leaves immediately above (el+1) and below (el-1) ear
leaves, during reproductive stages.
Final severity (FS, %) was determined at 100 DAS, corresponding
to the dough grain stage (R4) (29). Severity
assessments over time were used to calculate AUDPC for each hybrid using the
following equation:
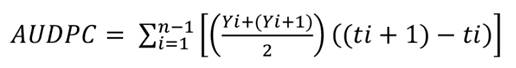
where:
Yi and Y1 + 1 =
disease severity values recorded in two consecutive assessments
[(ti + 1) - ti]= time interval between
assessments
n = number of
evaluations (23).
FS and AUDPC were
subjected to ANOVA and Tukey test (p= 0.05), with InfoStat statistical package
(11).
DPCs were
constructed by plotting accumulated disease severity (dependent variable)
against time (independent variable). Disease progress rate curves (dy/dt)
were also plotted for each hybrid at each location.
Disease severity data were fitted with nonlinear Logistic and
Gompertz models (20) for each hybrid x
location x replicate combination:
y = (1 + Be-rLt)-1
for the Logistic
model, and
y = exp(-Be-rGt)
for the Gompertz
model
where B = (1 -
y0) / y0 in Equation i and -ln(y0) in Equation ii
y = disease
severity (as a proportion)
rL and rG =
rate parameters for the Logistic and Gompertz models, respectively
t = time
y0 = disease severity at epidemic start (at V4, t
= 0). Model fit was evaluated using the coefficient of determination (R2)
of transformed disease proportion vs. time, and the
adjusted coefficient of determination (R2*) of predicted vs. observed values (nonlinearized, untransformed) (20).
Results and
Discussion
The temporal analysis of NCLB
epidemics revealed differences in DPCs, AUDPC, FS, and r among the four
evaluated hybrids across six localities during the 2015-16 growing season (table 2, table 3; figure 1 and figure 2).
Table 2. Final
severity (FS) and area under the disease progress curve (AUDPC) in maize
hybrids with different reactions to northern corn leaf blight (Exserohilum
turcicum) in central-northern Córdoba, Argentina, during 2015-16.
Tabla
2. Severidad final (FS) y área bajo la
curva de progreso de la enfermedad (ABCPE) en híbridos de maíz con diferente
respuesta al tizón foliar común del maíz (Exserohilum turcicum) en la
región centro-norte de Córdoba, Argentina, durante la campaña agrícola 2015-16.

Reaction: R = resistant, MR =
moderately resistant, MS= moderately susceptible, S = Susceptible; FS (%) =
final severity; AUDPC = area under the disease progress curve; * Different letters indicate statistically
significant differences, Tukey test (α = 0.05).
Reacción: R = resistente, MR =
moderadamente resistente, MS = moderadamente susceptible, S = Susceptible; FS
(%) = Severidad final; ABCPE = área bajo la curva de progreso de la enfermedad;
* Letras
diferentes indican diferencias estadísticamente significativas, test de Tukey
(α = 0,05).
Table 3. Nonlinear
regression for Logistic and Gompertz models fitted to disease severity data of
northern corn leaf blight (Exserohilum turcicum) in the 2015/16 season,
in Ballesteros, Villa María and Jesús María, central-northern Córdoba,
Argentina, for four maize hybrids with different reaction to NCLB.
Tabla
3. Regresión no lineal para modelos
Logísticos y Gompertz ajustados a los datos de la severidad del tizón foliar común
del maíz (Exserohilum turcicum) en la campaña agrícola 2015/16, en las
localidades de Ballesteros, Villa María y Jesús María, de la región
centro-norte de Córdoba, Argentina para cuatro híbridos de maíz con diferente
reacción a la enfermedad.
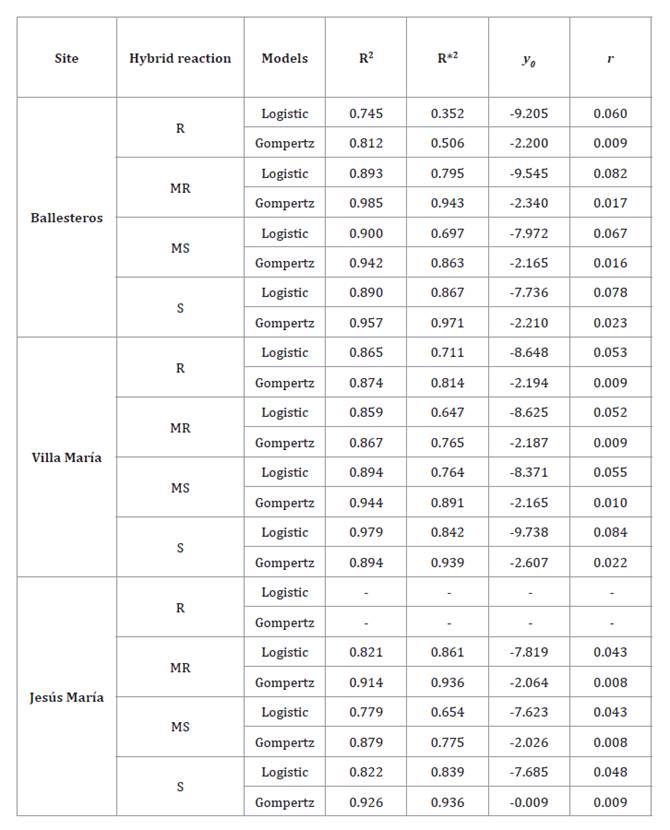
Reaction: R = Resistant. MR =
moderately resistant. MS = moderately susceptible. S = susceptible.
R2 = coefficient of determination; R*2 =
adjusted coefficient of determination between non-transformed observed and
predicted values; y0 =
initial inoculum; r = apparent infection rate
Reacción: R = resistente. MR =
moderadamente resistente. MS = moderadamente susceptible. S = susceptible.
R2 = coeficiente de determinación; R* 2 =
coeficiente de determinación entre los valores predichos y observados no
transformados; y0 =
inóculo inicial; r = tasa de infección aparente.
Reaction:
R = Resistant. MR = moderately resistant. MS = moderately susceptible. S =
susceptible.
Reacción:
R = resistente. MR = moderadamente resistente. MS = moderadamente susceptible.
S = susceptible.
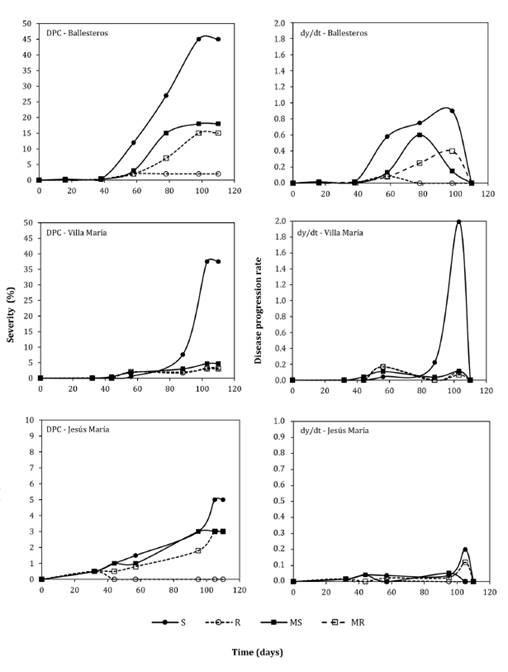
Figure
1. Disease progress curves (DPCs) and disease progress
rate curves (dy/dt) of northern corn leaf blight (NCLB) (Exserohilum
turcicum) in Ballesteros, Villa María, and Jesús María, central-northern
Córdoba, Argentina, during the 2015-16 season, for four maize hybrids with
different reactions to NCLB.
Figura
1. Curvas de progreso de la enfermedad
(DPC) y curvas de la tasa de progreso de la enfermedad en el tiempo (dy / dt)
del tizón foliar común del maíz (Exserohilum turcicum) en las localidades
de Ballesteros, Villa María y Jesús María, pertenecientes a la región
centro-norte de Córdoba, Argentina, durante la campaña agrícola 2015-16, para
cuatro híbridos de diferente reacción a la enfermedad.
Reaction:
R = Resistant. MR = moderately resistant. MS = moderately susceptible. S =
susceptible.
Reacción:
R = resistente. MR = moderadamente resistente. MS = moderadamente susceptible.
S = susceptible.
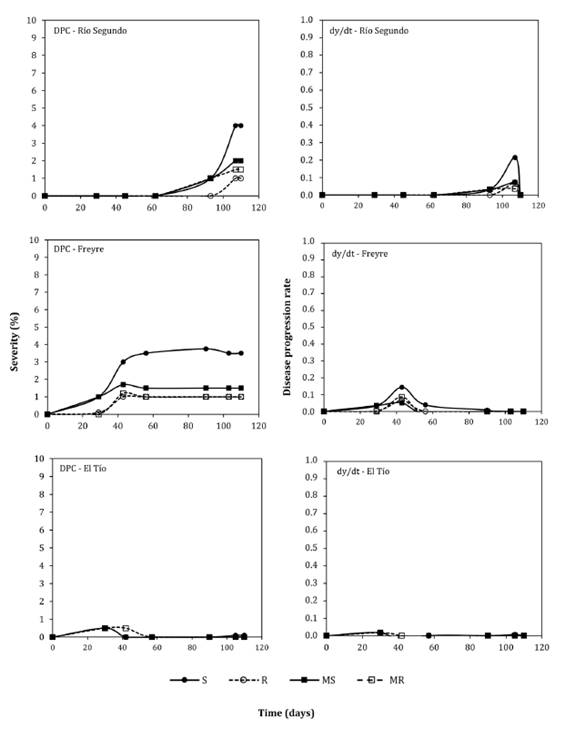
Figure
2. Disease progress curves (DPCs) and disease progress
rate curves (dy/dt) of northern corn leaf blight (NCLB) (Exserohilum
turcicum) in Río Segundo, Freyre and El Tío, central-northern Córdoba,
Argentina, during the 2015-16 season, for four maize hybrids with different
reactions to NCLB.
Figura
2. Curvas de progreso de la enfermedad
(DPC) y curvas de la tasa de progreso de la enfermedad en el tiempo (dy / dt)
del tizón foliar común del maíz (Exserohilum turcicum) en las
localidades de Río Segundo, Freyre and El Tío, pertenecientes a la región
centro-norte de Córdoba, Argentina, durante la campaña agrícola 2015-16, para
cuatro híbridos de maíz de diferente reacción a la enfermedad.
All hybrids exhibited similar
disease progress trends across the six localities. However, FS and AUDPC showed
statistically significant differences among localities (p<0.05). The
highest FS values in susceptible (S) hybrids were recorded in Ballesteros and
Villa María (45 and 37.5 %, respectively) (figure 3).

The
picture shows, from left to right, the leaf immediately below the ear leaf, the
ear leaf, and the leaf immediately above the ear leaf, at R4 phenological stage
in four maize hybrids with different reaction to NCLB: a) resistant, b)
moderately resistant, c) moderately susceptible and d) susceptible.
La
imagen muestra, de izquierda a derecha, la hoja inmediatamente inferior a la
hoja de la espiga, la hoja de la espiga y la hoja inmediatamente superior a la
hoja de la espiga, en la etapa fenológica R4, en cuatro híbridos de maíz con
diferente reacción al TFC: a) resistente, b) moderadamente resistente, c)
moderadamente susceptible y d) susceptible.
Figure
3. Final severity of northern corn leaf blight (NCLB),
caused by Exserohilum turcicum, in Ballesteros, central-northern
Córdoba, Argentina, during the 2015-16 season.
Figura
3. Severidad final del tizón foliar
común del maíz (TFC), causado por Exserohilum turcicum, en Ballesteros,
Córdoba, Argentina, durante la campaña 2015-16.
In contrast, FS
values in Jesús María, Río Segundo and Freyre were under 5%, while in El Tío,
under 1 %. Although disease pressure was low in the latter locations,
differences in FS remained statistically significant (p<0.05).
Similarly, the highest AUDPC values were observed in Ballesteros and Villa
María (2150.1 and 1335.7, respectively), whereas in the remaining localities,
AUDPC values were below 320, with statistically significant differences (p<0.05)
(table
2).
Notably, the February sowing date in Ballesteros was experimentally included to
expose the hybrids to different environmental conditions.
Both FS and AUDPC effectively differentiated hybrid reactions
across localities. FS is a practical and easy-to-measure parameter, whereas
AUDPC requires greater sampling effort but discriminates between hybrids with
similar disease behavior (table
2).
The FS assessed on el, el+1 and el-1 at R4 stage has been frequently reported
as strongly associated with yield losses, differentiating hybrids with
responses to NCLB (12, 25, 26).
The resistant (R)
hybrid showed the lowest FS and AUDPC values across all localities, remaining
symptomless in El Tío and Jesús María (table 2). Similarly,
apparent infection rates (r), estimated by the b parameter, ranged from 0.008
to 0.084 (table
3)
in Ballesteros, Villa María, and Jesús María. The R hybrid had the lowest r
among all genotypes, emphasising the importance of genetic resistance in
reducing disease prevalence in maize production systems. These findings align
with numerous reports emphasising the use of resistant cultivars as the most
cost-effective and sustainable approach for disease management (6,
27, 30).
Although nonlinear
models provided a reliable description of the temporal dynamics of NCLB across
different hybrids and locations, certain methodological limitations should be
acknowledged. First, the negative y₀ values (initial inoculum) observed in both
models should not be interpreted as actual inoculum levels but as model-derived
parameters resulting from mathematical fitting, lacking direct biological
meaning. Additionally, given extremely low or null infection levels, we could
not fit a model for the R hybrid in Jesús María, confirming the high resistance
level of this hybrid at this location.
Generally, the
Gompertz model provided better fits, consistent with its suitability for
polycyclic diseases. However, some exceptions were noted. The S hybrid in Villa
María exhibited higher R2 with the Logistic model, likely due to environmental
factors or differences in epidemic progression. This warrants further
investigation.
Substantial NCLB development in Ballesteros, Villa María, and
Jesús María provided suitable conditions for fitting and comparing temporal
epidemiological models. This was not feasible in Río Segundo, Freyre and El
Tío; thus, results from these localities are not presented. Epidemics exhibited
sigmoidal curves (figure
1
and figure
2),
characteristic of polycyclic diseases with multiple infection cycles during the
cycle (2, 13). The widely used Logistic and
Gompertz models well describe such development (1,
2, 5, 21, 33). Both models had highly significant fits, with R2 exceeding 80%. On
average, the Gompertz model provided the best fit across all genotypes, with R2= 0.909 and R2*= 0.849,
outperforming the Logistic model in all cases* (table 3). These findings
agree with Oddino
et al. (2010), who reported significant fits with both models for NCLB
epidemics in a susceptible corn genotype grown in Olaeta (southern Córdoba).
The Gompertz model had R2 over 80%, providing the
best fit across DPCs obtained under various fungicide application timings.
Both Logistic and
Gompertz curves are useful for modeling growth data. Despite certain
limitations, they share similar features. Symmetry is a drawback of the
Logistic model, whereas the asymmetrical Gompertz model has an earlier
inflexion point, making it more suitable for representing rapid-growth
biological phenomena (9).
The better fit of
the Gompertz model to NCLB epidemics reflects that the maximum disease rate
occurs earlier in this model than in the Logistic curve. Consequently,
according to this model, management decisions should be implemented earlier.
This observation aligns with Achicanoy López (2000) and March et
al. (2012), who emphasize that epidemiological models should be employed
to predict future disease levels and guide management action, avoiding crop
damage. Understanding DPCs enables accurate predictions of disease progression
and helps select optimal management strategies for specific pathosystems.
Several criteria
may identify the best-fitting model. However, R2 may not suit model
evaluation (15, 17). Instead, the
adjusted coefficient of determination (R2*)
derived from the regression between non-transformed observed and predicted
values provides a more accurate representation of disease progress (5). We provide both
coefficients, facilitating model comparison (table 3).
This study compared
different maize genotypes across multiple locations. In polycyclic diseases
such as NCLB, the initial inoculum has relatively little influence on FS,
whereas the number of infection cycles is critical (2,
22). Management tools in polycyclic diseases, like quantitative
resistance, environmental modification, and chemical control at sowing, are
commonly employed to reduce apparent infection rates, limiting the number of
infection cycles (32). Epidemiological
models summarize the disease vs. time
relationship into simple mathematical expressions, easing the analysis of
disease progression and resistance levels (2). While these
models simplify reality, they provide insights experimentally difficult or
impossible to obtain.
However,
considering no model has been specifically developed for plant pathology,
biological interpretations concerning variables and parameters require caution.
Proper analysis of these models helps elucidate field conditions and disease
progression patterns, supporting effective prevention and control strategies (1).
Vanderplank
(1963)
emphasized that genetics and chemistry constitute excellent disease control
tools, but epidemiology defines strategy. This link between epidemiology and
disease management remains essential (16, 34). Temporal analysis
provides quantitative insights for understanding epidemic drivers, pathosystem
comparisons, prediction systems development, risk mapping, and strategy
formulation (23). For the
maize-NCLB pathosystem, temporal analysis provides fundamental epidemiological
knowledge for mitigating disease impact in central-northern Córdoba.
Conclusions
The temporal
analysis of northern corn leaf blight (NCLB) epidemics in central-northern
Córdoba differentiated maize hybrids based on resistance levels and emphasized
epidemiological importance of genetic background. The evaluated hybrids
exhibited distinct disease progression dynamics, reflected in differences in
disease progression curves, final severity, area under the disease progression
curve, and apparent infection rates, validating their expected reactions to
NCLB.
Among the nonlinear models tested, the Gompertz model
consistently provided the best fit, suggesting an early exponential phase and
gradual disease progression, typical of NCLB under field conditions. These
findings help understand disease temporal dynamics and support the use of
quantitative epidemiological tools to guide hybrid selection and optimize
integrated disease management strategies against NCLB in maize production
systems.
Acknowledgements
We thank KWS Argentina S.A., for seed material, sowing support
and plot maintenance across the six locations.
1. Achicanoy López,
H. 2000. Descripción cuantitativa de las epidemias de las plantas. Revista
Facultad Nacional de Agronomía. Medellín. 53(1): 941-968.
2. Bergamin Filho,
A. 1995. Curvas de Progresso da doença. En: Bergamin Filho, A.; Kimati, H.;
Amorim, L. Manual de Fitopatologia. Vol.1: Princípios e Conceito. São Paulo:
Agronômica Ceres. p. 902-626.
3. Bergamin Filho,
A.; Amorin, L. 1996. Doencas de plantas tropicais: Epidemiologia e controle
económico. Sao Paulo: Ceres. p. 289.
4. Bolsa de
Cereales de Buenos Aires (BCBA), 2019. Panorama agrícola semanal (PAS).
Departamento de estimaciones agrícolas. Septiembre de 2019. Histórico.
5. Campbell, C. L.;
Madden, L. V. 1990. Introduction to plant disease epidemiology. New York. John
Wiley. p. 532.
6. Cia, E.;
Fuzatto, M. G. 1999. Manejo de doenças na cultura do algodão. En: Cia, E.;
Freire, E. C. & Santos, W. J. (Eds.) Cultura do algodoeiro. Piracicaba: Potafós.
p. 121-131.
7. CIMMYT. Centro
Internacional de Mejoramiento de Maíz y Trigo. 1985. Managing trails and
reporting data for CIMMYT’s International Maize Testing Programme. CIMMYT.
El Batan. Mexico.
8. De Rossi, R. L.;
Giménez Pecci, M. P.; Guerra, F. A.; Plaza, M. C.; Brücher, E.; Guerra, G. D.;
Torrico, A. K.; Camiletti, B. X.; Maurino, M. F.; Barontini, J.; Ferrer, M.;
Lucini, E.; Laguna, I. G. 2017. Enfermedades del maíz de siembra tardía
causadas por hongos. Libro resúmenes del I° Congreso de Maíz Tardío. Buenos
Aires, 20 de septiembre de 2016.
9. De Rossi, R. L.;
Guerra, F. A.; Plazas, M. C.; Vuletic, E. E.; Brücher, E.; Guerra, G. D.; Reis,
E. M. 2022. Crop damage, economic losses, and the economic damage threshold for
northern corn leaf blight. Crop Protection. Elsevier SCI LTD. vol. 154.
10. Dhar, M.;
Bhattacharya, P. 2018. Comparison of the Logistic and the Gompertz curve under
different constraints. Journal of Statistics and Management Systems. 21(7):
1189-1210. DOI:10.108 0/09720510.2018.1488414
11. Di Rienzo, J.
A.; Balzarini, M.; Casanoves, F.; Gonzalez, L.; Tablada, M.; Robledo, C. W.
2010. InfoStat, software estadístico. Universidad Nacional de Córdoba,
Argentina.
12. Fischer, K. S.;
Palmer, F. E. 1984. Tropical maize. En: Goldsworthy, P. R.; Fisher, N. M.
(Eds.). The physiology of tropical field crops. Wiley. p. 231-248.
13. Fry, W. E.
1982. Principles of plant disease management. Academic Press, Inc. p. 378.
14. Fullerton, R.
A. 1982. Assessment of leaf damage caused by northern leaf blight in maize. New
Zealand Journal of Experimental Agriculture. 10(3): 313-316.
DOI:10.1080/03015521.1 982.10427890.
15. Jeger, M. J.
1986. The potencial of analytic compared with simulation approaches to modeling
in plant disease epidemiology. In Leonard, K. J. & Fry, W. E. (ed). Plant
Disease Epidemiology. Population, Dynamics and Management. MacMillan, p.
255-281.
16. Jeger, M. J.
2000. Theory and plant epidemiology. Plant Pathology. 49: 651-658.
17. Jeger, M. J.
2004. Analysis of disease progress as a basis for evaluating disease management
practices. Annu. Rev. Phytopathology. 42: 61-82.
18. Kachapur, M.
R.; Hegde, R. K. 1988. Studies on Turcicum blight of maize (Zea mays L.)
caused by Exserohilum turcicum (Pass) Leonard & Suggs with special
reference to crop loss assessment. Plant pathology newsletter. 6: 33-35.
19. Kranz, J. 1974.
Comparison of epidemics. Ann. Rev. of Phytopathology.
12: 355-374.
20. Madden L. V.;
Hughes G.; Van Den Bosch, F. 2007. The study of plant disease epidemics. APS Press.
St. Paul, MN. p. 432.
21. March, G. J.;
Marinelli, A.; Oddino, C. M. 2004. Epidemiología aplicada al manejo de las
enfermedades de los cultivos. Manual Curso de Especialización en Protección
Vegetal. Universidad Católica de Córdoba. p. 110.
22. March, G. J.;
Marinelli, A.; Oddino, C. M. 2010. Manejo de enfermedades de los cultivos según
parámetros epidemiológicos. Córdoba: INTA-UNRC. p. 193.
23. March, G. J.;
Marinelli, A.; Oddino, C. M. 2012. Análisis del progreso de epidemias y
pérdidas que causan. Manual Curso de Especialización en Protección Vegetal.
Universidad Católica de Córdoba. p. 86.
24. Oddino, C.;
Marinelli, A.; García, J.; Garcia, M.; Tarditi, L.; Ferrari, S.; D´Eramo, L.;
March, G. J. 2010. Comparación del efecto de momentos de tratamientos
fungicidas sobre enfermedades foliares del maíz a través de modelos
epidemiológicos no flexibles. Libro de Actas IX° Congreso Nacional de Maíz,
Rosario, Argentina, p. 235-237.
25. Pataky, J. K.
1992. Relationships between yield of sweet corn and northern leaf blight caused
by Exserohilum turcicum. Phytopathology. 82: 370-375.
26. Paul, P. A.;
Munkvold, G. P. 2004. A model-based approach to preplanting risk assessment for
gray leaf spot of maize. Phytopathology. 94: 1350-1357.
27. Pereira, A. A.;
Zambolim, L.; Chaves, G. M. 1985. Melhoramento visando a resistência a doenças.
Informe Agropecuário, Belo Horizonte. 11(122): 82-92.
28. Perkins, J. M.; Hooker, A. L. 1981. Reactions of eighty-four
sources of chlorotic lesion resistance in corn to three biotypes of Helminthosporium
turcicum. Plant Dis. 65: 502-504.
29. Ritchie, S. W.;
Hanway, J. J.; Benson, G. O. 1986. How a corn plant develops? Iowa State. Univ.
Coop. Ext. Serv. Spec. Rep. N° 48. p. 1-21.
30. Sharma, R. C.;
Rai, S. N.; Batsa, B. K. 2005. Identifying resistance to banded leaf and sheath
blight of maize. Indian Phytopathology. 58: 121-122.
31. Teng, P. S.;
Zadoks, J. C. 1980. Computer simulation of plant disease epidemics. In:
McGraw-Hill Yearbook of Science and technology. p. 23-31.
32. Vanderplank, J.
E. 1963. Plant diseases: Epidemics and control. Academic Press, New York. p
349.
33. Waggoner, P. E.
1986. Progress curves of foliar disease: their interpretation and use. In:
Leonard, K. J.; Fry, N. E. eds. Plant Disease Epidemiology: Population dynamics
and management. New York. MacMillan. p. 3-54.
34. Zadoks, J. C.; Schein, R. D. 1979. Epidemiology and plant
disease management. New York. Oxford University Press. p. 427.