Revista de la Facultad de Ciencias
Agrarias. Universidad Nacional de Cuyo. Tomo 57(1). ISSN (en línea) 1853-8665.
Año 2025.
Original article
Methodological
analyses for determining thermal requirements of grape varieties in Tandil,
Argentina
Análisis de metodologías
para determinar los requerimientos térmicos de variedades de vid en Tandil,
Argentina
Laura Aguas1,
Gabriela Hernandez1,
Juan Laddaga1
1 Universidad Nacional del Centro de la Provincia de Buenos Aires
(UNCPBA). Facultad de Agronomía. NAACCE (Núcleo de estudios en actividades
agropecuarias y cambio climático). República de Italia 780. Azul (7300). Buenos
Aires. Argentina.
* lrodriguez@azul.faa.unicen.edu.ar
Abstract
This study
evaluated the thermal demand of different grapevine varieties (Cabernet Franc,
Merlot, Semillón, and Tannat) in Don Bosco, Tandil, Buenos Aires, Argentina.
Phenology was evaluated during four productive cycles, identifying periods from
budburst to flowering onset (BB-FO), flowering onset to veraison onset (FO-VO),
and veraison onset to maturity (VO-M). The National Meteorological Service of
Argentina provided daily maximum and minimum air temperatures. Six thermal sum
methods were used: methods 1.1, 1.2, and 1.3 depended on base temperature for
vine development (10°C); methods 2.1 and 2.2, considered base temperature and
optimum temperature (25°C); and method 3, considered base, optimum, and
threshold temperature (35°C). These methods were evaluated using the standard
error of the thermal sum. Methods 2.2 and 3 best fit all four varieties,
allowing adequate estimates of cumulative daily heat summation.
Keywords: degree-days, Vitis
vinifera L.,
phenology, temperate-humid climate
Resumen
El presente estudio
tuvo como objetivo evaluar los requerimientos térmicos de diferentes variedades
de vid (Cabernet Franc, Merlot, Semillón y Tannat) en viñedos plantados en Don
Bosco, Tandil, Buenos Aires, Argentina. Se evaluó cronológicamente el
desarrollo fenológico durante cuatro ciclos productivos, identificando las
fechas de ocurrencia de los eventos y delimitando la duración de los
subperíodos en días: inicio de brotación a inicio de floración, inicio de
floración a inicio de envero, y envero a madurez. Las temperaturas máximas y
mínimas diarias del aire se obtuvieron de los registros del Servicio
Meteorológico Nacional. Se emplearon seis métodos de suma térmica: los métodos
1.1, 1.2 y 1.3, que se basan exclusivamente en la temperatura base para el
desarrollo de la vid (10°C); los métodos 2.1 y 2.2, que, además de la
temperatura base, consideran también la temperatura óptima (25°C); y el método
3, que incorpora los parámetros anteriores junto con la temperatura umbral
(35°C). Estos métodos se evaluaron utilizando el error estándar de la suma
térmica. Los métodos 2.2 y 3 demostraron el mejor ajuste para las cuatro
variedades. Concluimos que los métodos 2.2 y 3 son más precisos en la estimación
de la suma térmica diaria para todas las variedades estudiadas.
Palabras clave: grados-días, Vitis
vinifera L.,
fenología, clima templado-húmedo
Originales: Recepción: 18/10/2023 - Aceptación: 06/02/2025
Introduction
Among climatic
factors, temperature plays a fundamental role in crop development. Temperature
controls vegetative growth and development. Thermal weather models predicting
plant development confirm its crucial role in phenology (54).
Grapevine (Vitis
vinifera L.) is one widely cultivated fruit crop (30). Optimal
production largely depends on local climatic conditions in each growing region (5). In modern
viticulture, identifying phenological phases for each cultivar is crucial for
effective crop management (21, 41). In recent
decades, several investigations have focused on predicting grapevine budburst,
flowering, and ripening (2, 15). Phenological
characterization and quantification of thermal units for each phase allow
harvest date estimations, suggesting site potential for viticulture (36). Thermal
quantification, known as thermal sum (39) and typically
expressed as degree-days (C° d) is widely used to account for temperature
effects on plant development (40, 43). Daily thermal sum
(DTS) considers average ambient temperature and basal temperature (BT) for each
species. Grapevine has a DTS of 10°C. When the value after subtracting BT from
average temperature is positive, degree-days are accumulated (16,
17, 25). This accumulated C°d can be calculated on a daily or monthly
basis, for each phenological stage (20). Villaseca
et al. (1986) indicated 850 to 950 C°d for early maturing table grape
varieties and 1150 to 1350 C° d for late maturing cultivars in Chile.
Chronological times between phenological stages vary with variety, climate, and
geographic location (48). Thus, before
introducing grape varieties in new regions, environmental effects on phenology
should be considered for better technological management (4).
Unfortunately,
research on grape phenology in southeastern Buenos Aires, Argentina, is
limited, especially when compared to other regions of the country, such as
Mendoza (14). In this province, the hilly area of Tandil constitutes
a promising region for viticulture. According to Godoy and Gancedo (2022) hilly areas
adequately satisfy the thermal needs of Merlot and Cabernet Franc, being Tandil
an emerging region. European grape varieties of different cycles and origins
are being evaluated in Tandil. According to the National Institute of Viticulture
of Argentina (2022), vineyards in Buenos Aires grew by 200% between 2011 and 2021.
Several authors consider a BT of 10 °C to characterize varietal
thermal requirements (29, 32, 35, 39). However, this
varies with phenology. The optimal growth temperature ranges from 25 to 30°C (9). Above 30°C,
growth decelerates, ceasing at approximately 38°C (38). Research on
optimal temperature for each developmental stage indicates optimal average
daily temperature for budburst above 10-12°C, between 18 and 22°C for
flowering, between 22 and 26°C from flowering to veraison, and between 20 and
24°C from veraison to ripening (38).
Methods to
calculate DTS are related to cardinal temperatures for plant development or
based on air temperature (53). The former are
grouped according to whether they only rely on BT or include optimum or upper
threshold temperatures for plant development. The latter are grouped according
to whether they rely on mean air temperature or also consider minimum and
maximum temperatures (40, 51).
Defining
phenological stages allows for rationalizing and optimizing cultural practices
in vine cultivation (26). This study
evaluated thermal requirements of Cabernet Franc, Merlot, Semillón, and Tannat
varieties, by different calculation methods in the hilly region of Tandil,
Buenos Aires province.
Materials
and methods
The research was
conducted at a commercial property called “Viñedo y Bodegas Cordón Blanco,” in
Tandil, southeastern Buenos Aires province (37°22’28” S, 59°06’23” W, altitude
of 271 m) (figure
1).
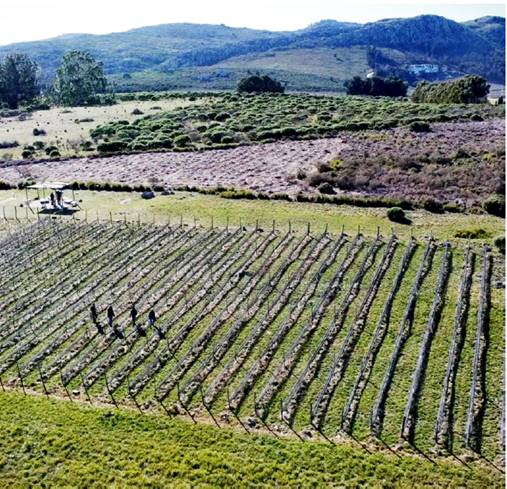
Figure 1. Aerial
view of the “Cordón Blanco” vineyard, located in Tandil, Buenos Aires province,
Argentina, in September 2021.
Figura
1. Vista aérea del viñedo “Cordón Blanco”, ubicado en
Tandil, Buenos Aires, en septiembre del 2021.
The 1.8-hectare
vineyard was planted in 2008 with 1.8 m between rows, 1.2 m between plants, and
4,700 plants per hectare. It is subdivided into 40 x 25 m plots, with one vine
variety per plot. We assessed four plots with Cabernet Franc, Merlot, Semillón,
and Tannat. Soil is clayey and climate is temperate-humid with mild summers.
Average annual temperature is 14.2°C, and average annual rainfall is 827 mm.
Considering vine growing cycle from September to March, average rainfall is
539.5 mm, and average maximum and minimum temperatures are 23.9°C and 9.8°C,
respectively (data provided by the National Meteorological Service of
Argentina, SMN).
The vineyard was agronomically managed by pruning and
phytosanitary controls. The four varieties were grafted onto a ‘101-14 Mgt’
rootstock, a V. riparia/V. rupestris hybrid, easy to root and graft, and
resistant to Daktulosphaira vitifoliae (phylloxera) (31). Starting in 2013,
monitoring began from budburst to berry softening during 2013 - 2014, 2016 -
2017, 2018 - 2019, and 2019 - 2020 seasons. Determinations started from the
fifth growth cycle, with a fully established crop, selecting five plants from
different points within each plot, considered replicates. Phenology related to
thermal summation was evaluated chronologically by identifying dates for each
event, determining subperiods, in days.
Main phenological
stages (24) were identified via Biologische
Bundesanstalt Bundessortenamt Chemise (BBCH) scale, including sub-stages 05
(10-15% budburst) to 09 (end of budburst), 65 (flowering), 81 (veraison onset),
and 85 (softening of berries, start of grape maturation). Budburst was
determined when 50% of buds had visibly burst, at sub-stage 07 in the BBCH
scale. Sub-stage 81 (veraison onset) was established by berry color change.
Following this phenological scale, varietal growth cycles were evaluated up to
sub-stage 85, until berry softening.
Minimum (Tmin) and maximum (Tmax) air temperatures and daily
rainfall were obtained from the SMN. Daily mean air temperature (Tm) was
calculated as the arithmetic mean between daily Tmin and Tmax. As described,
thermal requirements were calculated as the sum of degree-days (°C d) for each
phenological sub-period and from budburst to ripening. DTS (C° d) was
determined via six different methods: method 1.1 (12), method 1.2 (52), method 1.3 (45,
47), method 2.1 (34), method 2.3 (28), and method 3 (49,
55). These were grouped according to whether they used only BT
(methods 1.1, 1.2, and 1.3), i.e. the temperature at which the vine
metabolic process is minimum (10°C), the optimum temperature (OT) (methods 2.1
and 2.2), or the three cardinal temperatures: BT, OT and upper threshold (TT)
(method 3). Table
1
shows all six methods.
Table 1. Daily
thermal sum (DTS) methods used, equation, calculation concerning temperature
parameters, and references.
Tabla
1. Método de suma térmica diaria (STD)
utilizado con la fórmula final, su base de cálculo en relación con las
temperaturas empleadas y la bibliografía asociada a cada método.
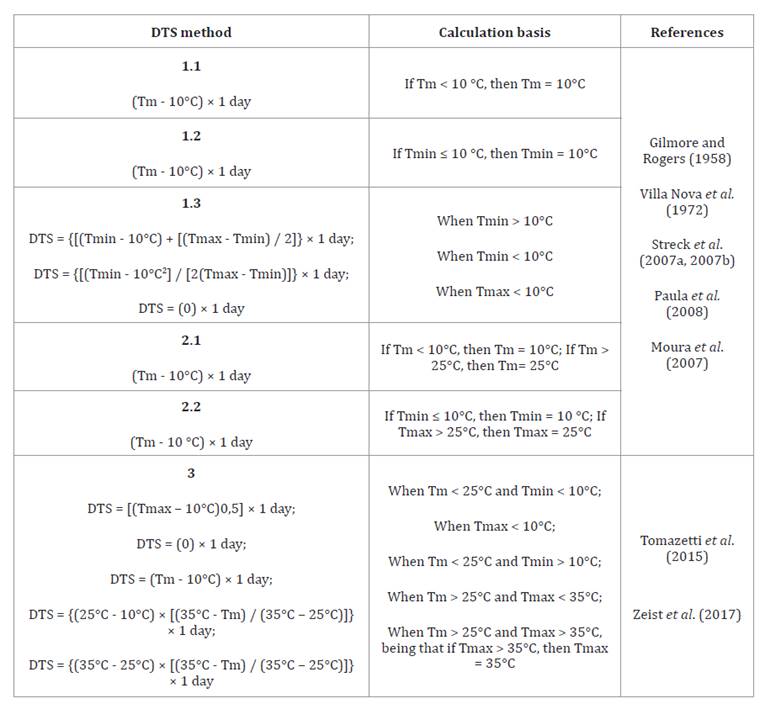
Tmax is maximum temperature, Tm
is mean temperature, and Tmin is minimum temperature. Cardinal temperatures are
the lower basal temperature (10°C), the optimum temperature (25°C), and the
upper threshold temperature (35°C).
Tmax se refiere a la temperatura
máxima, Tm a la temperatura media y Tmin a la temperatura mínima. Las
temperaturas cardinales son: Temperatura base inferior (10°C), óptima (25°C) y
umbral superior (35°C).
For BT, OT, and TT,
10, 25, and 35°C were adopted respectively (55) (table 1). Cumulative
thermal sum (CTS) for the whole cycle and each subperiod included individual
DTS, i.e. CTS = ΣDTS (12, 44). Years were
considered replicates and varietal CTS was assessed by calculating the standard
error of the mean (SE). The SE of the CTS was obtained after calculating the
standard deviation of the mean CTS for each year. The thermal requirements
needed to complete the cycle and each phenological stage were subjected to
ANOVA and compared by Tukey’s test, with Infostat software (10) at p ≥ 0.05.
Results
and discussion
During the four years, absolute minimum and maximum temperatures
fluctuated between -6.5°C and 39.3°C, respectively (table 2).
Table 2. Phenological
evaluation of “Cabernet Franc”, “Merlot”, “Semillón” y “Tannat” (Vitis
vinífera L.) in Tandil, Buenos Aires province, from September to February.
Tabla
2. Periodos de evaluación fenológica
de las 4 variedades de Vitis Vinifera L. plantadas en Tandil, Buenos
Aires.
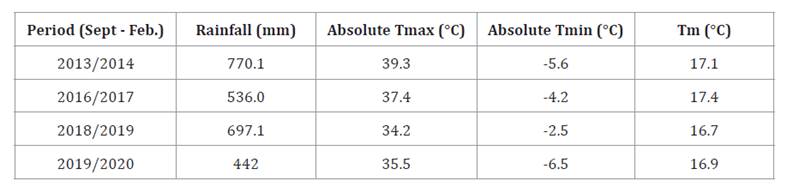
Rainfall (mm), mean (Tm),
absolute maximum (Tmax), and minimum (Tmin) temperatures (°C) recorded in each
growth cycle.
Precipitaciones (mm), Temperaturas
medias (Tmed), máximas (Tmax) y mínimas (Tmin) absolutas (°C) registradas en
cada ciclo de crecimiento.
Temperatures below BT (10°C) were recorded in all production
cycles (figure
2),
primarily between budburst and flowering onset (BB-FO). During November,
coinciding with FO, average maximum temperature was 25°C in all four periods,
with an average minimum temperature of 10°C. These conditions fell within the
range between BT (10°C) and OT (25°C) (figure 2).
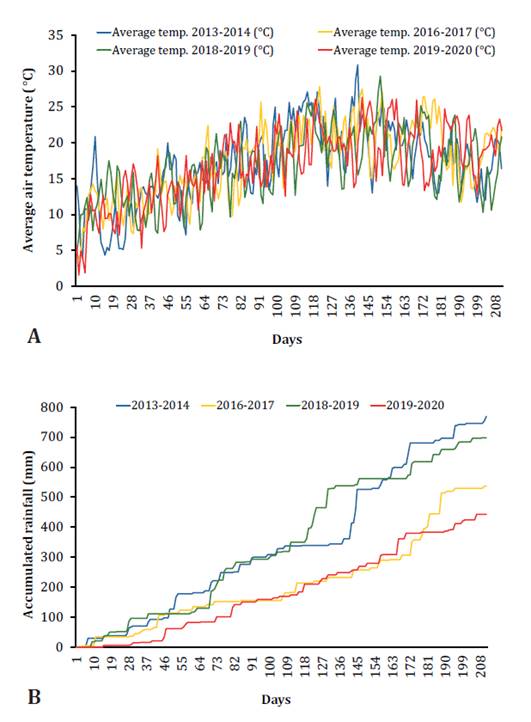
Figure 2. A. Average air temperature
(°C) and B. Accumulated
rainfall (mm) from September 1 to the end of March in four seasons, for
Cabernet Franc, Merlot, Semillón, and Tannat grapevines (Vitis vinifera L.)
in Tandil, Buenos Aires province, Argentina.
Figura
2. A. Temperaturas medias del aire
(°C) y B. Precipitaciones acumuladas (mm), desde el 1 de septiembre hasta
finales de marzo en cuatro temporadas, para las variedades de vid Cabernet
Franc, Merlot, Semillón y Tannat (Vitis vinifera L.) en Tandil,
provincia de Buenos Aires, Argentina.
In December, average maximum temperature reached 29°C during
FO-VO and 20°C when calculated as mean temperature considering the four growth
cycles. Finally, temperatures above TT (35°C) were recorded in all four
production cycles, particularly during 2013-2014, on December 23, 24, 28, and
29, and January 6, 15, 17, and 18. Noticeably, total rainfall recorded in 2013
was 762.6 mm, below the historical average of 30 years (889 mm), while in 2014
was 1402 mm, significantly above historical average for Tandil. Table 2 shows
442 mm total rainfall in the last cycle (2019-2020), and during winter before
BB, minimum temperature of -7.8°C and rainfall of 18 mm.
The complete cycle from BB to M lasted, on average, 161 days for
Cabernet Franc, 162 days for Merlot, 161 days for Tannat, and 154 days for
Semillón. No differences were observed between varieties (p > 0.05). Table 3 details
phenological dates for all four seasons.
Table 3. Phenological
dates for Semillón, Cabernet Franc, Merlot, and Tannat varieties, recorded
during four growing seasons: 2013 - 2014, 2016 - 2017, 2018 - 2019, and 2019 -
2020, in Tandil, Buenos Aires province.
Tabla
3. Fechas de los estadios fenológicos
observados en las variedades: Semillón, Cabernet Franc, Merlot y Tannat,
registrados durante 4 ciclos de cultivo: 2013 - 2014, 2016 - 2017, 2018 - 2019
y 2019 - 2020, en Tandil, Buenos Aires.
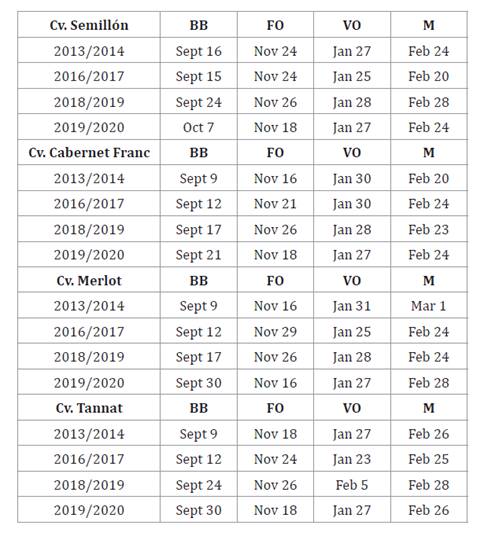
Budburst (BB), flowering onset
(FO), veraison onset (VO), and berry softening (M).
Los eventos fenológicos registrados
fueron inicio de la brotación (IB), inicio de la floración (IF), inicio del
envero (IE), y ablandamiento de yemas (M).
Methods 2.2 and 3
showed the most precise heat summation adjustments considering the whole cycle
in Tannat, Semillón, and Cabernet Franc, given lower standard errors (SE)
obtained in the FO-VO subperiod (table 4).
Table 4. Mean
duration of each subperiod (BB-FO, FO-VO, and VO-M, in days), + standard
deviation.
Tabla
4. Duración media de cada subperiodo en días, con su
desvío estándar, IB-IF (días), IF-IE (días), IE-M (días).
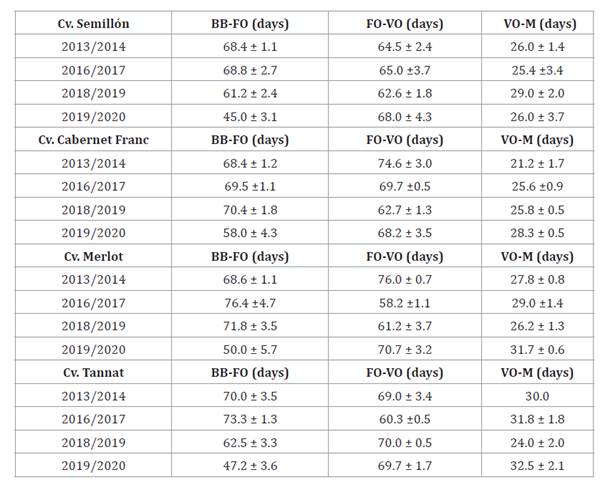
The table the average duration of
each subperiod in days, along with its standard deviation: BB-FO (days), FO-VO
(days), VO-M (days).
La tabla expresa la duración media
de cada subperiodo en días, con su desvío estándar, IB-IF (días), IF-IE (días),
IE-M (días).
These methods did
not statistically differ from each other (p > 0.05) but did differ from
method 1.2 for all varieties (table 5). Considering method 2.2, CTS for Tannat, Semillón, and
Cabernet Franc were 1219, 1182, and 1198°C d, respectively, with SE values of
13.5, 31.5, and 11.78°C d. In contrast, when using method 3, CTS were 1152,
1124, and 1135 C° d, respectively, with SE values of 28.7, 44.8, and 28.1 C° d
(table
5).
For Merlot, method 3 provided the best adjustment (lowest SE), with 1145 C° d
CTS and an SE of 30.4 C° d. For Cabernet Franc and Tannat, medium and medium-late
maturing varieties respectively, method 3 also showed a statistical difference
of 1.3 (p < 0.05) compared to method 2.2 (table 5).
Table 5. Average
cumulative thermal sum (CTS) calculated for each subperiod (BB - FO, FO - VO,
and VO - M) and the BB-M period for the four varieties by six methods of
calculation of daily thermal sum (DTS).
Tabla
5. Suma térmica acumulada (STA) media
calculada para cada subperíodo (IB - IF, IF - IE, IE - M) y para el período IB
- M, para las 4 variedades, utilizando los 6 métodos de cálculo de la suma
térmica diaria (STD).
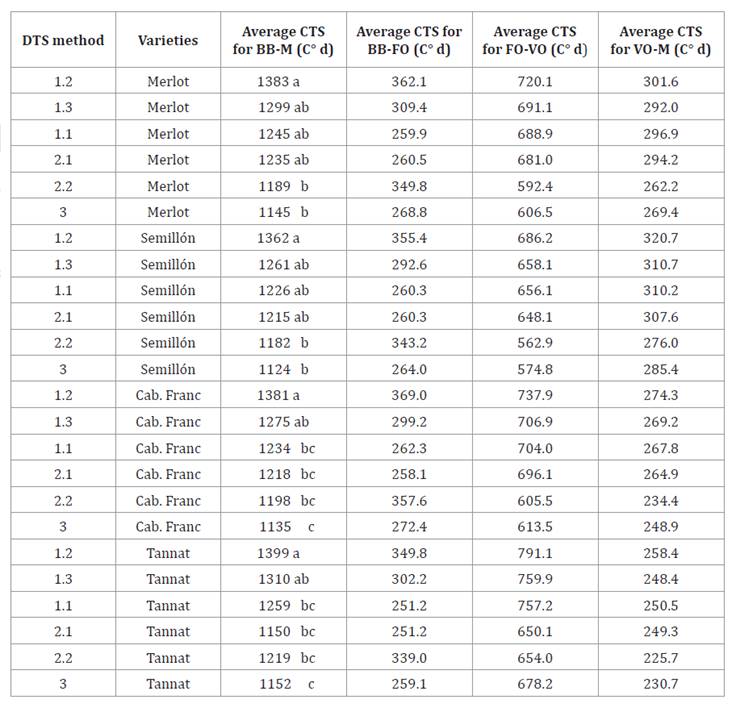
Different letters in columns
indicate statistical differences (p > 0.05).
Valores en las columnas seguidos de
la misma letra, no difieren entre sí por la prueba de Tukey (p > 0,05).
Thermal demands for each subperiod were also calculated after
the six thermal summation methods (figure 3 and figure
4).
Noticeable trends were observed among thermal sums for the four varieties, particularly
in the first subperiod (BB-FO), where methods 2.2 and 1.2 had higher CTS values
than the other methods (figure
3).
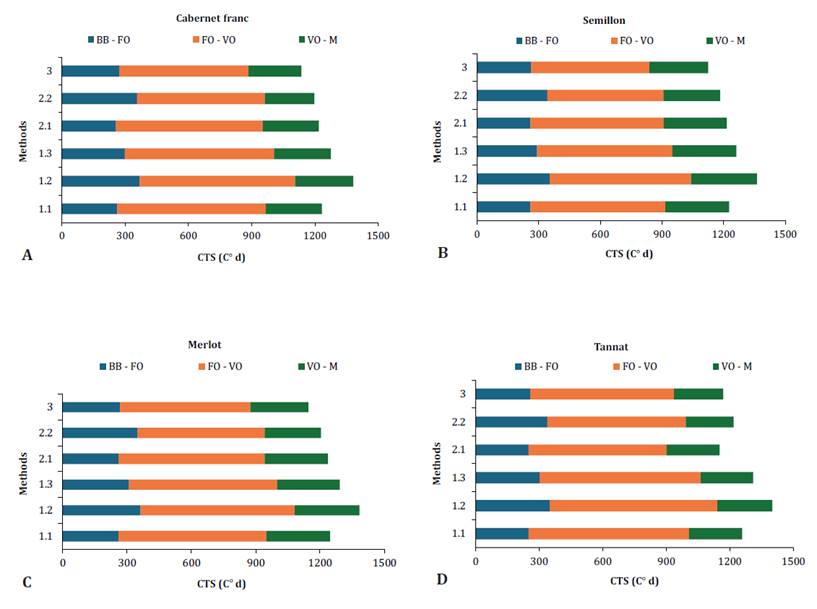
Figure 3. Cumulative
thermal sum (CTS, C° d) calculated for each subperiod: budburst to flowering
onset (BB-FO), flowering to veraison (FO - VO), and veraison to berry softening
(VO - M), by six methods (1.1, 1.2, 1.3, 2.1, 2.2, and 3) estimating STD in
Cabernet Franc, Semillón, Merlot, and Tannat, in Tandil, Buenos Aires province.
Figura
3. Suma térmica acumulada (STA, °C d)
calculada para cada subperíodo: inicio de la brotación - inicio de la floración
(IB - IF), inicio de la floración - inicio del envero (IF - IE), inicio del
envero - ablandamiento de bayas (IE - M), utilizando seis métodos (1.1, 1.2, 1.3,
2.1, 2.2, y 3), estimando la STA en las variedades Cabernet Franc, Semillón,
Merlot y Tannat, en Tandil, provincia de Buenos Aires.
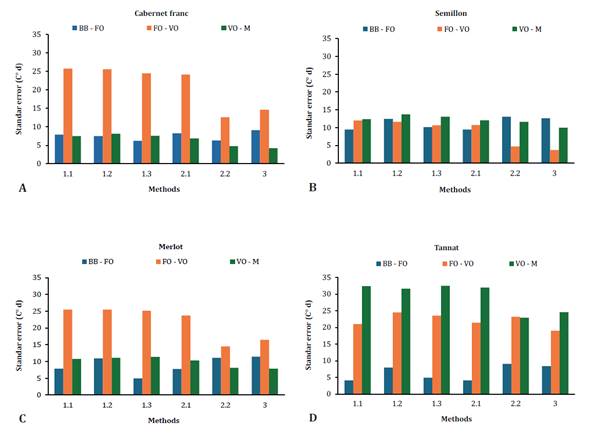
Figure 4. Standard
error (SE) of cumulative thermal sum (CTS, C° d) for each subperiod: budburst
to flowering (BB - FO), flowering to veraison (FO - VO) and veraison to berry
softening (VO - M). Six methods (1.1, 1.2, 1.3, 2.1, 2.2, and 3) estimated
daily thermal sum (DTS) in Cabernet Franc, Semillón, Merlot, and Tannat in
Tandil, Buenos Aires province.
Figura
4. Error estándar (ES) de la suma
térmica acumulada (STA, °C d) para cada subperíodo: inicio de la brotación -
inicio de la floración (IB - IF), inicio de la floración - inicio del envero
(IF - IE), inicio del envero - ablandamiento de bayas (IE - M). Seis métodos (1.1,
1.2, 1.3, 2.1, 2.2 y 3) estimaron la suma térmica diaria (STD) en las
variedades Cabernet Franc, Semillón, Merlot y Tannat en Tandil, provincia de
Buenos Aires.
These methods assume that when minimum temperatures are lower
than or equal to BT, minimum temperature equals BT and overestimates DTS and
CTS, especially in cold months with temperatures below BT. Method 2.1 resulted
in the lowest SE in Tannat and Semillón, with CTS values of 251.2 ± 16.6 C° d
and 260.3 ± 37.9 C° d, respectively.
In Semillón, no
difference was found among methods (p > 0.05), whereas in Tannat, however,
method 2.1 differed from methods 1.2 and 2.2 (p < 0.05). In Cabernet Franc,
methods 1.3 and 2.2 yielded similar SE values (6.2°C d), with CTS 300 C° d and
357 C° d, respectively, while in Merlot method 1.3 yielded a lower SE (figure 4), and no
differences with methods 2.2 and 3 (p > 0.05). Overall, methods 2.2 and 1.2
had significantly (p > 0.05) higher CTS values for this subperiod (BB - FO),
while method 2.1 yielded the lowest CTS for Tannat and Semillón. Additionally,
Tannat had a significantly different CTS calculated using method 2.1 from the
estimated using methods 1.2 and 2.2 (p < 0.05). Although these variations
between methods showed no differences for most varieties, they suggest that
calculation method influences CTS estimation. Considering Cabernet Franc and
Merlot, BB occurred on September 15 and 17, respectively, averaging four
observation cycles (table
3).
In other regions of South America, such as southern Brazil, BB for Merlot and
Cabernet Franc occurs around September 13 (26). Additionally,
during 2018-19 and 2019-20, a two-week delayed BB was observed compared to
previous years (table
3).
This delay could be attributed to the lower temperatures recorded toward the
end of winter, along with lower precipitation (figure 2), considering
varietal BB phenological pattern is primarily influenced by air temperature (26).
The longest
subperiod (63 - 91 days) with the highest thermal sum requirement was FO-VO, in
all four varieties. Minimum SE for this subperiod was recorded for methods 2.2
and 3. Considering Merlot, Cabernet Franc, and Tannat, no statistical
differences were observed with the other methods (figure 4). However, for
Semillón, methods 2.2 and 3 showed differences in SE (figure 4) and CTS (table 4) compared to
methods 1.1, 1.2 and 1.3 (p < 0.05). Merlot had CTS ± SE of 592.2 ± 14.5 C°
d with method 2.2 and 606.5 ± 16.4 C° d with method 3. Semillón, showed 562.9 ±
4.7 C° d with method 2.2 and 574.8 ± 3.7 C° d with method 3. Cabernet Franc had
CTS 605.5 ± 12.6 C° d with method 2.2 and 613.5 ± 14.6 C° d with method 3.
Finally, CTS in Tannat was 662.5 ± 19.0 C° d with method 3. Considering Tannat,
all six methods showed high SE (figure 4).
The VO-M subperiod
showed no statistical differences among methods (p > 0.05) or the four
varieties. However, method 3 yielded the best fit in three varieties (figure 4). In detail, CTS ±
SE for Merlot, Cabernet Franc, and Semillón were 269.4 ± 7.9 C° d, 248.9 ± 4.2
C° d, and 285.4 ± 10.0 C° d respectively. Instead, in the VO-M subperiod,
Tannat showed higher SE than the other varieties while, with method 2.2, it
obtained the minimum SE (figure
4)
with CTS of 225.7 ± 24.6 C° d. This late variety had a delayed VO in the last
two cycles (table
3).
Between February 20 and March 1, 50% of the plants of all varieties (table 3) were at sub-stage
89. Harvesting occurred later, particularly in the intermediate to late
varieties. As latitude increases, more days are needed to reach a particular
phenological stage (3).
Methods 1.1, 1.2,
and 1.3 generated higher SE values for the four varieties. This lower
methodological efficiency in representing thermal accumulation has been
previously reported in southern Brazil (49). These three
methods, based only on BT, showed higher variability (high SE) in CTS
estimation than methods considering OT (methods 2.1 and 2.2) and TT (method 3).
In other crops like wheat, Rosa et al. (2009) found that methods
incorporating daily minimum and maximum air temperature to cardinal
temperatures, improved phenological simulation. Our results indicate greater
accuracy in calculating the thermal sum via methods including OT and TT in
addition to BT. Therefore, we discourage methods based solely on the BT,
especially considering that, during summer, higher temperatures can affect
plant metabolism (45, 49).
These results
suggest that, concerning grapevine development and climate change scenarios,
simulations should use methods 2.1, 2.2, and 3. This is particularly relevant
for Buenos Aires and its frequent extreme climatic events (6). Future scenarios
predict increasing average air temperature in several regions of the planet (19), with negative
consequences for viticulture (52). This acceleration
of climate change invalidates old phenological calculations based on number of
days (8, 22). Recent studies have shown
significant correlations between temperature increase and earlier beginning of
several stages in grapevine (1), with shortened
phenological stages (3, 20, 41). Some prominent
phenological changes suggest a significantly reduced anthesis-ripening duration
(26). Besides reduced
vine growth and yields, other possible undesirable implications for the wine
industry include changes in wine quality (11,
37, 50, 52). In this context, considering that grapevine phenology is a
crucial indicator of environmental impacts (7), accurate
estimations of thermal requirements based on cardinal temperatures can be
beneficial, regardless of the time required to satisfy them (33).
Considering methods 2.2 and 3, both demonstrating the lowest SE
in the CTS, the varieties evaluated exhibited no statistical differences in
thermal requirements during FO-VO and VO-M. Both methods estimated SE from 0.77
to 1.66 days for FO-VO and from 0.47 to 1.47 days for VO-M for Cabernet Franc,
Merlot, and Semillón, indicating relatively low dispersion compared to the
other four methods, where SE was twice higher. For Tannat, SE was two days,
using these methods and approximately four days with the remaining four
methods, in both subperiods. In BB-FO, the lowest SE was 1.18 days by method
2.2 for Cabernet Franc, while SE for the other varieties, was higher.
Our results provide
information on thermal requirements of four grapevine varieties at different
phenological stages in the region of Tandil, center Buenos Aires, Argentina.
The use of degree-days improved phenological prediction, compared to other
approaches considering days between phenological events (23). Considering the
onset of autumn in our region, high humidity levels and low evapotranspiration
may negatively affect fruit quality. Therefore, harvest should occur before the
end of March. Future research should determine thermal requirements for
maturity and harvest, contributing to climate risk mitigation and definition of
optimal harvest time.
Conclusion
According to method
3, Merlot, Cabernet Franc, Semillón, and Tannat grown in Tandil require 1145,
1135, 1125, and 1153 C° d, respectively, to reach BBCH sub-stage 85.
The period between
budburst and flowering onset showed the highest variability in thermal sum when
comparing six methods for thermal requirement determination.
We conclude that
methods 2.2 and 3 most accurately estimate cumulative daily heat summation in these
varieties, in Tandil, using optimum temperature and upper threshold temperature
for Vitis vinifera L.
Method 2.2 was accurate in this specific region, given the low
frequency of temperatures above 35°C during the periods evaluated. Considering
changes in climatic events in the center of Buenos Aires, we recommend models
capable of recording daily variations in maximum and minimum temperatures.
Further research will determine thermal requirements of different grapevine
varieties in this region, especially between veraison and harvest.
1.
Alikadic, A.; Pertot, I.; Eccel, E.; Dolcia, C.; Zarbo, C.; Caffarra, A.; De
Filippi, R.; Furlanello, C. 2019. The impact of climate change on grapevine
phenology and the influence of altitude: A regional study. Agric. For.
Meteorol. 271: 73-82.
2.
Almanza, P.; Serrano, P.; Fischer, G. 2012. Manual de viticultura tropical.
Grupo Imprenta y Publicaciones UPTC. Tunja. Colombia. 120 p.
3.
Antonacci, D.; Ramos, J.; Dalla, J. 2001. Infuenza della disponibilitá termica
sulle manifestazioni fenologiche della vite in diverse aree di produzione dei
due emisferi. Frutticoltura e di ortofloricoltura. 63(12): 65-72.
4.
Anzanello, R.; Souza, P. V. D. de; Coelho P.F. 2012. Fenologia, exigência
térmica e produtividade de videiras ‘Niagara Branca’, ‘Niagara Rosada’ e
‘Concord’ submetidas a duas safras por ciclo vegetativo. Revista Brasileira de
Fruticultura. 34: 366-376.
5.
Bem, B. P. de; Bogo, A.; Everhart, S.; Casa, R. T.; Gonçalves, M. J.; Marcon
Filho, J. L.; Cunha, I. C. da. 2015. Effect of Y-trellis and vertical shoot
positioning training systems on downy mildew and botrytis bunch rot of grape in
highlands of southern Brazil. Scientia Horticulturae. 185: 162-166. DOI:
10.1016/j.scienta.2015.01.023
6.
Confalone, A.; Navarro, M.; Vilatte, C.; Aguas, L.; Lázaro, L.; Mestelan, S.;
Sau, F. 2016. Parametrización y uso del modelo CROPGRO -soja en Azul, Buenos
Aires. Revista de la Facultad de Ciencias Agrarias. Universidad Nacional de
Cuyo. Mendoza. Argentina. 48(1): 49-64.
7.
Bernardo, S.; Dinis, L. T.; Machado, N.; Moutinho-Pereira, J. 2018. Grapevine
abiotic stress assessment and search for sustainable adaptation strategies in
Mediterranean-like climates. A review. Agron. Sustain. 38(66).
8.
Bock, A.; Sparks, T.; Estrella, N.; Menzel, A. 2011. Changes in the phenology
and composition of wine from Franconia, Germany. Clim. Res. 50: 69-81.
9.
Del Barrio, R. A; Gallo, S. L.; Martin, D. M. 2016. Aspectos bio y
agroclimáticos del cultivo de vid para vinificar en el Valle Inferior del Río
Negro. RIA. Rev. Investig. Agropecu. 42(3): 283-290.
http://www.scielo.org.ar/scielo.php?script=sci_arttext&pid=S1669-
23142016000300008&lng=es&nrm=iso.
10.
Di Rienzo, J. A.; Casanoves, F.; Balzarini, M. G.; Gonzalez, L.; Tablada, M.;
Robledo, C. W. 2019. InfoStat versión 2019. Centro de Transferencia InfoStat,
FCA. Universidad Nacional de Córdoba. Argentina. http://www.infostat.com.ar
11.
Fraga, H.; Malheiro, A. C.; Moutinho-Pereira, J.; Santos, J. A. 2012. Future
scenarios for viticultural zoning in Europe: Ensemble projections and
uncertainties. Int. J. Biometeorol. 57: 909-925.
12.
Gilmore, E.; Rogers, J. S. 1958. Heat units as a method of measuring maturity
in corn. Agron. J. 50: 611-615.
13.
Godoy Baduino, C. A.; Gancedo Desgens, E. 2022. Aptitud vitícola del sudeste
bonaerense en base a índices bioclimáticos. Rev. Facultad de Agronomía UBA.
42(2): 7-12.
14.
Gomez Talquenca, S.; Lanza Volpe, M.; Setien, N.; Gracia, O.; Grau, O. 2023.
Serological relationships among strains of grapevine leafroll-associated virus
4 reflect the evolutive behavior of its coat protein gene. Revista de la
Facultad de Ciencias Agrarias. Universidad Nacional de Cuyo. Mendoza.
Argentina. 55(1): 104-114. DOI: https://doi.org/10.48162/rev.39.100.
15.
Gris, E. F.; Burin, V. M.; Brighenti, E.; Vieira, H.; Bordignon-Luiz, M. T.
2010. Fenología y maduración de las variedades de Vitis vinifera L. de
uva en São Joaquim, sur de Brasil: una nueva región de cultivo de la vid en
América del Sur. Cien. Inv. Agr. 37(2): 61-75.
16.
Hidalgo, L. 2002. Tratado de viticultura general. Ediciones Mundi-Prensa,
Madrid.
17.
Ibacache G. A. 2008. Cómo influye la temperatura sobre la época de cosecha en
vides [en línea]. Tierra Adentro. 81: 8-10.
https://hdl.handle.net/20.500.14001/6416 (Consultado: 30 abril 2024).
18.
Instituto Nacional de Vitivinicultura. 2022. Informe elaborado por el
laboratorio estadístico del Instituto Nacional de Vitivinicultura. Registro de
viñedos y superficie. Mendoza.
19.
IPCC 2022: Climate Change 2022: Mitigation of climate change. Contribution of
working Group III to the sixth assessment report of the intergovernmental panel
on climate change [P.R. Shukla, J. Skea, R. Slade, A. Al Khourdajie, R. van
Diemen, D. McCollum, M. Pathak, S. Some, P. Vyas, R. Fradera, M. Belkacemi, A.
Hasija, G. Lisboa, S. Luz, J. Malley, (eds.)]. Cambridge University Press.
Cambridge. UK and New York. NY. USA. DOI: 10.1017/9781009157926
20.
Jones, G. V.; Alves, F. 2012. Impact of climate change on wine production: A
global overview and regional assessment in the Douro Valley of Portugal. Int.
J. Glob. Warm. 4: 383-406.
21.
Jubileu, B. S.; Sato, A. J.; Roberto, S. R. 2010. Caracterização fenológica e
produtiva das videiras ‘Cabernet Sauvignon’ e ‘Alicante’ (Vitis vinifera L.)
produzidas fora de época, no norte do Paraná. Revista Brasileira de
Fruticultura. 32: 451-462.
22.
Labbé, T.; Pfister, C.; Brönnimann, S.; Rousseau, D.; Franke, J.; Bois, B.
2019. The longest homogeneous series of grape harvest dates, Beaune 1354-2018,
and its significance for the understanding of past and present climate. Clim.
Past. 15: 1485-1501. DOI: 10.5194/ cp-15-1485-2019
23.
Li, Z.; Huang, H.; Duan, Z.; Zhang, W. 2023. Control temperature of greenhouse
for higher yield and higher quality grapes production by combining STB in
situ service with on time sensor monitoring. Heliyon. 9(2): e13521.
24.
Lorenz, D. H.; Eichhorn, K. W.; Blei-Holder, H.; Klose, R.; Meier, U.; Weber,
E. 1994: Phänologische Entwicklungsstadien der Weinrebe (Vitis vinifera L.
ssp. vinifera). Vitic. Enol. Sci. 49: 66-70.
25.
Lucas, D. D. P.; Streck, N. A.; Bortoluzzi, M. P.; Trentin, R.; Maldaner, I. C.
2012. Temperatura base para emissão de nós e plastocrono de plantas de
melancia. Revista Ciência Agronômica. 43: 288-292. DOI:
10.1590/S1806-66902012000200011
26.
Mandelli, F.; Berlato, M. A.; Tonietto, J.; Bergamaschi, H. 2003. Fenologia da
videira na Serra Gaúcha. Pesquisa Agropecuária Gaúcha. 9: 129-144.
27.
Moriondo, M.; Bindi, M. 2007. Impact of climate change on the phenology of
typical Mediterranean crops. Ital. J. Agrometeorol. 3: 5-12.
28.
Moura, M. S. B. de; Brandao, E. O.; Soares, J. M.; Donosco, C. S.; Silva, T. G.
F. da; Souza, L. S. B. 2007. Exigência térmica e caracterização fenológica da
videira Cabernet Sauvignon no Vale São Francisco, Brasil. Congreso
Latinoamericano de Viticultura y Enología. Mendoza. Seduciendo al consumidor de
hoy. Mendoza: IVV: CLEIFRA: SECYT. 2007.
29.
Nagata, R. K.; Scarpare Filho, J. A.; Kluge, R. A.; Nova, N. A. V. 2000.
Temperatura base e soma térmica (graus-dia) para videiras ‘Brasil’ e
‘Benitaka’. Revista Brasileira de Fruticultura, Cruz das Almas. 22(3): 329-333.
30.
Nikolaou, K. E.; Chatzistathis, T.; Theocharis, S.; Argiriou, A.; Koundouras,
S.; Zioziou, E. 2022. Cultivars Effects of chromium toxicity on physiological
performance and nutrient uptake in two grapevine cultivars (Vitis vinifera L.)
growing on own roots or grafted onto different rootstocks. Horticulturae. 8(6):
493. https://doi.org/ 10.3390/horticulturae8060493
31.
Nikolaou, K. E.; Chatzistathis, T.; Theocharis, S.; Argiriou, A.; Koundouras,
S. 2023. Physiological and nutritional responses of ungrafted merlot and
cabernet sauvignon vines or grafted to 101-14 Mgt and 1103P rootstocks exposed
to an excess of boron. Horticulturae. 9(4): 508. https://doi.org/10.3390/
horticulturae9040508
32.
Oliveira, M. 1998. Calculation of budbreak and flowering base temperatures for Vitis
vinifera cv. Touriga Francesa in the Douro Region of Portugal. Am. J. Enol.
Vitic. 49: 74-78.
33.
Parker, A. K.; García de Cortázar-Atauri, I.; Gény, L.; Spring, J. L.; Destrac,
A.; Schultz, H.; Molitor, D.; Lacombe, T.; Graça, A.; Monamy, C.; Stoll, M.;
Storchi, P.; Trought, M. C. T.; Hofmann, R. W.; van Leeuwen, C. 2020.
Temperature-based grapevine sugar ripeness modelling for a wide range of Vitis
vinifera L. cultivars. Agric. For. Meteorol. 285-286:107902. doi:
10.1016/j. agrformet.2020.107902
34.
Paula, G. M. de; Streck, N. A. 2008. Temperatura base para emissão de folhas e
nós, filocrono e plastocrono das plantas daninhas papuã e corriola. Ciência
Rural. 38: 2457-2463.
35.
Pedro Júnior, M. J.; Sentelhas, P. C.; Pommer, C. V.; Martins, F. P. 1994.
Determinação da temperatura-base, graus-dia e índice biometeorológico para a
videira ‘Niagara Rosada’. Revista Brasileira de Agrometeorologia, Santa Maria.
2: 51-56.
36.
Radünz, A. L.; Schöffel, E. R.; Borges, C. T.; Malgarim, M. B.; Pötter, G. H.
2015. Necessidades térmicas de videiras na região da Campanha do Rio Grande do
Sul - Brasil. Ciência Rural. 45: 626-632. DOI: 10.1590/0103-8478cr20140134
37.
Reyes, M. 2015. Informe proyecto “Aseguramiento de la sustentabilidad de la
viticultura nacional frente a los nuevos escenarios que impone el cambio
climático”. Código 502063-70. Centro Regional de Investigación Raihuen.
38.
Reynier, A. 2005. 6ª ed. Manual de Viticultura. Mundi-Prensa. Madrid. España.
497 p.
39.
Roberto, S. R.; Sato, A. J.; Brenner, E. A.; Jubilei, B. S.; Santos, C. E.;
Genta, W. 2005. Caracterização fenológica e exigência térmica (graus-dia) para
a uva ‘Cabernet Sauvignon’ em zona subtropical. Acta Scientiarum Agronomy.
27(1): 183- 187.
40.
Rosa, H. T.; Walter, L. C.; Streck, N. A.; Alberto, C. M. 2009. Métodos de soma
térmica e datas de semeadura na determinação de filocrono de cultivares de
trigo. Pesquisa Agropecuária Brasileira. 44: 1374-1382.
41.
Santos, C. E. dos; Roberto, S. R.; Sato, A. J.; Jubileu, B. da S. 2007.
Caracterização da fenologia e da demanda térmica das videiras ‘Cabernet
Sauvignon’ e ‘Tannat’ para a região norte do Paraná. Acta Scientiarum.
Agronomy. 29: 361‑366.
42.
Sato, A. J.; Jubileu, B. da S.; Assis, A. M. de; Roberto, S. R. 2011.
Fenologia, produção e composição do mosto da ‘Cabernet sauvignon’ e ‘Tannat’ em
clima subtropical. Revista Brasileira de Fruticultura. 33: 491‑499. DOI: 10.1590/S0100‑29452011005000079
43.
Stenzel, N. M. C.; Neves, C. S. V. J.; Marur, C. J.; Scholz, M. B. d. S.;
Gomes, J. C. 2006. Maturations curves and degree-days accumulation for fruits
of “Folha Murcha” organge trees. Sci. Agric. 63(3): 219-225.
44.
Streck, N. A.; Tibola, T.; Lago, I.; Buriol, G. A.; Heldwein, A. B.; Schneider,
F. M.; Zago, V. 2005. Estimativa do plastocrono em meloeiro (Cucumis melo L.)
cultivado em estufa plástica em diferentes épocas do ano. Ciência Rural. 35:
1275 1280.
45.
Streck, N. A.; Alberto, C. M. 2006. Estudo numérico do impacto da mudança climática
sobre o rendimento de trigo, soja e milho. Pesquisa Agropecuária Brasileira.
41: 1351‑1359.
46.
Streck, N. A.; Michelon, S.; Rosa, H. T.; Walter, L. C.; Bosco, L. C.; Paula,
G. M. de; Camera, C.; Samboranha, F. K.; Marcolin, E.; Lopes, S. J. 2007a.
Filocrono de genotipos de arroz irrigado em função da época de semeadura.
Ciência Rural. 37: 323‑329.
47.
Streck, N. A.; Paula, F. L. M. de; Bisognin, D. A.; Heldwein, A. B.; Dellai, J.
2007b. Simulating the development of field grown potato (Solanum tuberosum L.).
Agricultural and Forest Meteorology. 142: 1‑11.
DOI: 10.1016/j.agrformet.2006.09.012
48.
Tesic, D.; Woolley, D. J.; Hewett, E. W.; Martin, D. J. 2001. Environmental
effects on cv Cabernet Sauvignon (Vitis vinifera L.) grown in Hawke’s
Bay, New Zealand: 2. Development of a site index. Australian journal of grape
and wine research. 8(1): 27-35.
49.
Tomazetti, T. C.; Rossarolla, M. D.; Zeist, A. R.; Giacobbo, C. L.; Welter, L.
J.; Alberto, C. M. 2015. Fenologia e acúmulo térmico em videiras viníferas na
região da Fronteira Oeste do Rio Grande do Sul. Pesquisa Agropecuária
Brasileira. 50: 1033-1041.
50.
Van Leeuwen, C.; Destrac-Irvine, A.; Dubernet, M.; Duchêne, E.; Gowdy, M.;
Marguerit, E.; Pieri, P.; Parker, A.; De Rességuier, L.; Ollat, N. 2019. An
update on the impact of climate change in viticulture and potential
adaptations. Agronomy. 9: 514.
51.
Venios, X.; Korkas, E.; Nisiotou, A.; Banilas, G. 2020. Grapevine responses to
heat stress and global warming. Plants. 9(12): 1754. https://doi.org/10.3390/plants9121754
52.
Villa Nova, N. A.; Pedro Jr, M. J.; Pereira, A. R.; Ometto, J. C. 1972.
Estimativa de graus-dia acumulados acima de qualquer temperatura base, em
função das temperaturas: máximas e mínimas. Caderno de Ciências da Terra. São
Paulo. 30: 1-8.
53.
Villaseca, S.; Novoa, R.; Muñoz. I. 1986. Fenología y sumas de temperatura en
24 variedades de vid. Agricultura Técnica. Chile. 46: 63-67.
https://hdl.handle.net/20.500.14001/41010
54.
Zapata, D.; Salazar-Gutierrez, M.; Chaves, B.; Keller, M.; Hoogenboom, G. 2017.
Predicting key phenological stages for 17 grapevine cultivars (Vitis
vinifera L.). American Journal Enology and Viticulture. 68: 60-72. DOI:
10.5344/ajev.2016.15077
55.
Zeist, A. R.; Tomazetti, T. C.; Rossarolla, M. D.; Alberto, C. M.; Giacobbo, C.
L.; Welter, L. J. 2017. Plastochron index of ‘Cabernet Sauvignon’ and
‘Chardonnay’ grapevines in Fronteira Oeste, in the state of Rio Grande do Sul,
Brazil. Pesquisa Agropecuária Brasileira. 52(4): 244-251. https://doi.org/10.1590/S0100-204X2017000400004