Revista de la Facultad de Ciencias
Agrarias. Universidad Nacional de Cuyo. Tomo 57(1). ISSN (en línea) 1853-8665.
Año 2025.
Original article
Pesticide
drift: comparing spraying systems under variable field climatic conditions
Deriva
de pesticidas: un estudio comparativo entre sistemas de aspersión bajo
condiciones climáticas variables de campo
Camila Rebelatto
Muniz1,
Guilherme Braga
Pereira Braz1*,
Matheus de Freitas
Souza1,
Indiamara Marasca2,
Camila Jorge
Bernabé Ferreira1,
Renata Pereira
Marques3,
Alaerson Maia
Geraldine3,
Lais Regina Tereza
Torquato Reginaldo4
1 Universidade de Rio Verde. Programa de Pós-graduação em
Produção Vegetal. Fazenda Fontes do Saber.
Campus Universitário. Caixa Postal 104. Rio Verde. Goiás. Brasil. CEP:
75901-970.
2 UniLaSalle Lucas do Rio Verde. Faculdade de Agronomia. Av.
Universitária. 1000 W - Parque das Emas. Lucas do Rio Verde. Mato Grosso.
Brasil. CEP: 78455-000.
3 Instituto Federal Goiano. Programa de Pós-graduação em
Bioenergia e Grãos. Rodovia Sul Goiana. km 01. Zona Rural. Rio Verde. Goiás.
Brasil. CEP: 75901-970.
4 Instituto Goiano de Agricultura. Departamento de Pesquisa.
Rodovia GO-174. km 45. Zona Rural. Caixa Postal 61. Montividiu. Goiás. Brasil.
CEP: 75915-000.
* guilhermebrag@gmail.com
Abstract
Safe pesticide
application must ensure efficacy in pest control while minimizing environmental
and human health risks. This study investigated pesticide potential drift by
comparing ground and aerial spraying systems under different climatic
conditions. The research was conducted in Rio Verde, Goiás, Brazil, using a
randomized block experimental design with 10 repetitions and a 2 x 2 split-plot
scheme, considering spraying systems and climatic conditions as factors. Favorable
and Unfavorable conditions were determined by relative air humidity,
temperature, and wind speed. Aerial spraying was performed using a Cessna
aircraft, while terrestrial spraying was done using a self-propelled Montana
Parruda sprayer. Variables assessed included Volumetric Median Diameter (VMD),
droplet density (DEN), and target coverage. Results revealed that aerial
spraying has a higher drift potential, exceeding 180 m, compared to terrestrial
spraying, limited to 90 m under unfavorable conditions. Although terrestrial
spraying produces larger droplets, its shorter distance to the target and
reduced speed minimize lateral movement, limiting drift potential. Droplet
density and non-target area coverage were low for both systems, (0.1%). Under
ideal conditions, aerial spraying is more efficient, but both methods require
rigorous safety measures to prevent contamination risks. This study underlines
the importance of considering droplet size and specific environmental
conditions when choosing a spraying system, contributing to safer and more
efficient agricultural practices.
Keywords: aerial application,
terrestrial spraying, application technology
Resumen
La aplicación
segura de pesticidas en grandes cultivos es una preocupación crucial para
garantizar la eficacia en el control de plagas y al mismo tiempo minimizar los
riesgos ambientales y para la salud humana. En este contexto, este estudio
investigó la posible deriva de pesticidas comparando sistemas de fumigación
terrestre y aérea en diferentes condiciones climáticas. La investigación se
realizó en Rio Verde, Goiás, Brasil, utilizando un diseño experimental de
bloques al azar con 10 repeticiones. Se adoptó un esquema de parcelas divididas
2 x 2, considerando los factores de los sistemas de aspersión y las condiciones
climáticas. Las condiciones favorables y desfavorables se determinaron mediante
parámetros como la humedad relativa del aire, la temperatura y la velocidad del
viento. La aspersión aérea se realizó mediante una aeronave Cessna, mientras
que la aspersión terrestre se realizó mediante un aspersor autopropulsado
Montana Parruda. Las variables evaluadas en este estudio incluyeron el diámetro
medio volumétrico (VMD), la densidad de gotas (DEN) y la cobertura objetivo.
Los resultados revelaron que la aspersión aérea tiene un mayor potencial de
deriva, alcanzando distancias superiores a 180 m, en comparación con la
aspersión terrestre limitada a 90 m en condiciones desfavorables. Aunque la
pulverización terrestre produce gotas más grandes, su distancia más corta al objetivo
y su velocidad reducida minimizan el movimiento lateral, lo que limita el
potencial de deriva. La densidad de gotas y la cobertura del área no objetivo
son bajas para ambos sistemas y se mantienen por debajo del 0,1%. En
condiciones ideales, la fumigación aérea es más eficiente, pero ambos métodos
requieren medidas de seguridad rigurosas para prevenir riesgos de
contaminación. Este estudio enfatiza la importancia de considerar no solo el
tamaño de las gotas sino también las condiciones ambientales específicas al
elegir un sistema de aspersión, lo que contribuye a prácticas agrícolas más
seguras y eficientes.
Palabras clave: aplicación aérea,
fumigación terrestre, tecnología de aplicación
Originales: Recepción: 19/11/2023- Aceptación: 12/09/2024
Introduction
Pesticides have
been used in agriculture for centuries to protect crops against pests,
diseases, and weeds (4). Despite studies
demonstrating that their use can be reduced by combining other control methods,
such as biological control (14), these products
are still necessary for agriculture, especially considering large-scale cultivation
and crop productive potential (16). This dependence
on pesticides is evident in numbers. The European Union, Brazil, the United
States, and China, worldwide major food producers, used approximately 827
million, 831 million, 1.2 billion, and 3.9 billion pounds of pesticides in
2016, respectively (5, 8, 25). This scenario
remains for most food-producing countries (22). Therefore,
adjusting the spraying system and minimizing pesticide impact on non-target
organisms, is crucial.
Pesticide-safe
application should consider four pillars: the formulated product, target,
timing, and spraying system. The first three pillars directly affect system
choice. Consequently, all 4 pillars should be analyzed jointly. Once these
pillars are properly adjusted, efficient applications assure minimum non-target
organism contamination (1). When these
components are not well dimensioned, drift and evaporation, two main
contamination pathways, are considerably increased. The adopted spraying system
and the environmental conditions during application (timing) strongly influence
risk potential (2, 3).
Pesticide drift is the unintentional transport of spray droplets
away from the control target. Often, this transport leads to contamination of
urban areas, forests, and rivers (3).
Drift can be studied as primary and secondary drift. Primary drift results from
the transport of an active ingredient away from the intended area, after
passing through the spray nozzle, due to airflow during application (3).
Secondary movement occurs after pesticide application due to chemical
volatilization (15).
Unlike secondary drift, many factors resulting in primary movement are largely
under human control (3).
Studies on
pesticide drift often focus on herbicide application risks given the possibility
of intoxicating neighboring crops or native forests (3). Recently, this
issue has gained attention given soybean cultivars resistant to dicamba and
2,4-D. These herbicides belong to the auxin mimics class, and the high
sensitivity of dicotyledonous crops, including non-resistant soybeans, has
increased crop damage in non-target areas. These reports are more frequent for
dicamba (3). For example, in 2017, the USA
reported 2708 cases of dicamba drift-induced injuries (21) while in Brazil,
auxin herbicides stand as the main reported contamination in non-target areas.
Between 2018 and 2021, 431 positive cases of auxin herbicide drift were
recorded in the state of Rio Grande do Sul (9).
Although many
studies address drift, associating this practice with contamination of
neighboring crops, urban areas and native forests deserves particular
investigation given human health and environmental safety. In Brazil, 2021
recorded 30 cases of pesticide drift in urban areas. Of these cases, 21 were
caused by aerial applications of fungicides or insecticides (9). In Rio Verde,
Goiás, 120 students were hospitalized due to drift caused by the aerial
application of [thiamethoxam + lambda-cyhalothrin] (19).
Concerning human
and environmental safety, Law N° 19423 of July 26, 2016, published in the
Official Gazette on August 4, 2016, establishes restrictions on aerial spraying
considering minimum distance from non-target locations: 500 m from urban
perimeters and 250 m for public water reservoirs. For terrestrial sprayings, a
minimum distance of 100 m is established from the urban perimeter, 200 m for
public water reservoirs, and 50 m for isolated dwellings and animal clusters.
Aerial application restrictions are stronger since droplet size and target
distance may increase aerial drift compared to terrestrial spraying (2).
Despite
restrictions, drift can reach greater distances. Even for primary drift, where
the applicator can control some factors, drift still brings uncertainties
during pesticide applications. Consequently, more studies should assess real
drift, considering interactions between different spraying systems and
environmental conditions. These studies are even more relevant in tropical
conditions given higher frequency of unfavorable application conditions like
high temperatures, lower relative humidity, and wind gusts (10). To facilitate
drift deposit measurement processes, some researchers collect deposits on a
drift test bench (11, 20) or in wind tunnels
(6). Despite their
advantages, these indirect methods cannot reproduce real aerial applications,
and comprehensive field studies must be conducted (2). In this context,
we studied the potential drift of ground and aerial spraying systems and the
relationship between these systems and environmental conditions during field
trials, identifying possible shortcomings in the current restrictions for
pesticide spraying.
Materials
and methods
The experiment was
conducted in the municipality of Rio Verde (Goiás), Brazil (17°46’34.5” S
51°01’81.1” W). The region’s climate is classified as B4 rB’4a’ (humid; slight
water deficiency; mesothermal; summer evapotranspiration less than 48% of the
annual evapotranspiration), according to Thornthwaite (1948).
The experiment was conducted in a randomized complete block
design with 10 replications. A 2 x 2 split-plot design was adopted to identify
interactions between ground and aerial spray systems and climatic conditions
during application. The climatic factor defined the main plots, while the spray
system was defined in subplots. Two climatic conditions were considered, one Favorable
and the other Unfavorable. Factor randomization in subplots was done
by randomly selecting application moments for Favorable and Unfavorable
classes. The parameters relative air humidity, instantaneous temperature,
and wind speed determined Favorable and Unfavorable conditions (table
1).
Table 1. Climatic
conditions during spraying with the different equipment.
Tabla 1. Condiciones
climáticas durante la pulverización con los diferentes equipos.
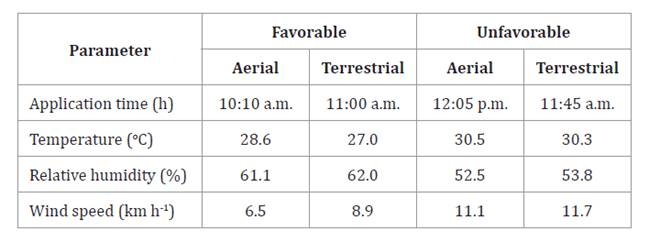
Climatic data were obtained using an INSTRUTHERM THAL-300 thermo-hygro-anemometer.
A wind direction indicator (windsock) was installed in the experimental area to
guide application direction.
Aerial spraying was
performed with a Cessna aircraft, Ag Truck model, with a capacity of 810 kg,
equipped with Full Cone Hollow Core D6 Orifice 56 nozzles, set to provide a
“Very Fine” droplet spectrum. Spray volume was 20 L ha-1,
at 26 Psi, with a travel speed of 187 km h-1 and flight height of 3 m.
These parameters were determined by regional frequent use. Terrestrial spraying
was performed using a self-propelled Montana Parruda sprayer, model MA2527,
equipped with a Flat Fan Jet ST 03 nozzle, set to provide a “Large” droplet
spectrum. Spray volume was 80 L ha-1,
and working pressure was 55 Psi, with travel speed of 20 km h-1 and a spray bar height of
0.50 m. These criteria were based on recommendations for each system for the
lowest drift risk without compromising target coverage efficiency. Reservoirs
of both spraying equipment contained only water. Regardless of the application
system, applications were always perpendicular to wind direction.
Drift potential was estimated through hydro-sensitive papers
attached to a wooden support at 45° angle relative to the wooden support. The
26 x 76 mm hydro-sensitive paper spray cards were purchased in TeeJet
Technologies® (São Paulo,
Brazil). The wooden supports were positioned equidistantly every 20 m, using
the last external tip of the spraying bar as a reference, always
perpendicularly to the application and in line with wind direction. Wooden
supports positioned at the same distance from the spraying bar were placed
every 10 m, totaling 100 meters (considering the 10 repetitions). Thus, the
distance covered for each treatment was 100 m. Figure 1
illustrates the wooden supports distribution. Wooden supports were positioned
at a maximum distance of 200 meters from the first wooden support.
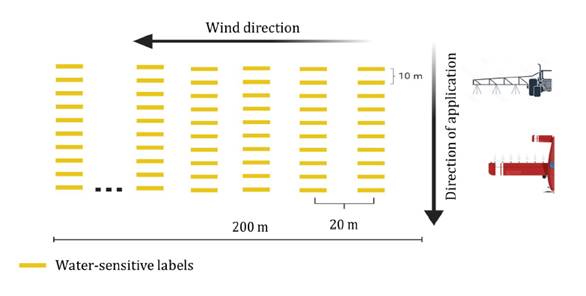
Figure 1. Scheme
of the arrangement of water-sensitive papers in the experimental area.
Figura 1. Representación
gráfica de la disposición de los papeles sensibles al agua en el área
experimental.
After the spraying,
the hydro-sensitive papers were removed and placed in a paper envelope for
subsequent scanning using the CIR 1.5 software (13), at 600 dpi. After
scanning, the parameters volumetric median diameter (VMD), droplet density
(DEN) (drops cm-2),
and coverage percentage were obtained for each experimental unit.
Statistical
analyses were performed using SISVAR software (7). After checking
ANOVA assumptions, the F-test, was performed. When assumptions were not met,
data were transformed using the Box-Cox criterion, followed by ANOVA and
Tukey’s test (p-value < 0.05).
Results
The ANOVA results
for Spray Systems vs. Environmental Conditions are presented in
Supplementary Material S1. The Volumetric Median Diameter (VMD) showed a
significant interaction effect for either Spray Systems or Environmental
Conditions, with distances exceeding 140 m.
Figure 2, shows differences
in VMD between spraying systems under Favorable and Unfavorable
Conditions. Under Favorable conditions, the aerial application
system provided a higher VMD (ranging from 54 to 250 μm) compared to the
ground-based system (ranging from 78 to 25 μm) for distances from 20 to 140 m.
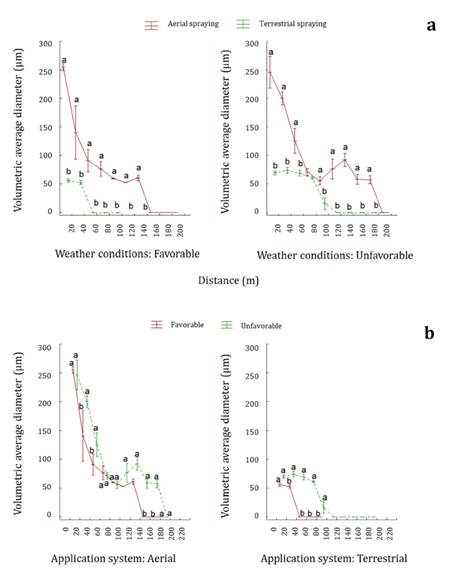
Lowercase letters
show statistical differences.
Las
letras minúsculas muestran diferencias estadísticas.
Figure
2. Volumetric mean diameter (μm) obtained by applications
in a: two environmental conditions (favorable and unfavorable) from b:
aerial and terrestrial application systems, over 200 meters considering
perpendicular drift.
Figura
2. Diámetro volumétrico medio (μm)
obtenido por aplicaciones en a: dos condiciones ambientales (favorable y
desfavorable) y b: del sistema de aplicación aérea y terrestre en una
distancia de 200 metros considerando un movimiento perpendicular de la deriva.
Beyond 140 m, no
droplets were detected in either spraying system under Favorable conditions.
Droplets were detected only up to 40 m for the ground-based spraying system. In
aerial application, 74 μm VMD droplets were detected up to 140 m. Under Unfavorable
conditions, the behavior between spraying systems for VMD was similar to Favorable
conditions for most distances, with higher VMD values for the aerial
system. Similarity in VMD between systems was only observed at 80 m.
The VMD was higher
for the Unfavorable condition and aerial spraying at 40, 60, 100, 120,
140, 160, and 180 m (figure
2b).
The maximum distance at which droplets were detected for Favorable and Unfavorable
aerial applications was 120 m (74 μm) and 180 m (77 μm), respectively. In
the terrestrial spraying, the Unfavorable condition also resulted in a
higher VMD, reaching a maximum distance of 100 m (25 μm) and 40 m (51 μm),
respectively. These results demonstrate that environmental conditions at
application will influence drift potential, with greater risk under Unfavorable
weather conditions.
Under Favorable conditions,
aerial application resulted in a higher droplet density on non-target areas,
compared to terrestrial spraying. Droplet density values ranged from 2 to 23
drops cm-2 for aerial application
and 1 to 9 drops cm-2 for terrestrial spraying
(figure
3a).
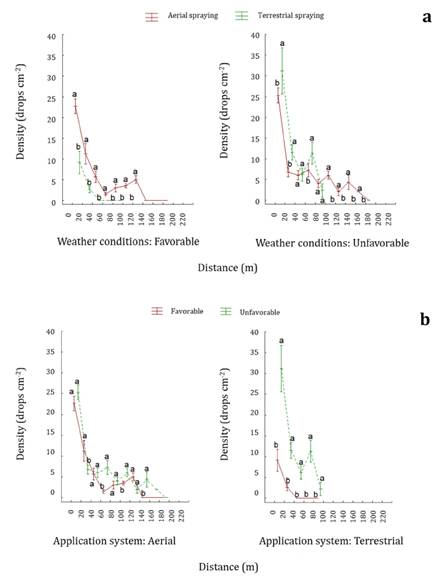
Lowercase letters
in figure 3a
differentiate application systems at each distance for each condition.
Lowercase letters in figure 3b
differentiate application conditions at each distance for both application
system.
Las
letras minúsculas en la figura 3a
diferencian los sistemas de aplicación en cada distancia evaluados para cada
condición de aplicación. Las letras minúsculas en la figura
3b diferencian las condiciones de aplicación en cada
distancia evaluada para cada sistema de aplicación.
Figure
3. Density (drops cm-2) in two environmental conditions
(favorable and unfavorable) from aerial and terrestrial application systems
over 200 meters considering perpendicular drift in relation to the application.
Figura
3. Densidad (gotas cm-2) obtenida por aplicaciones en dos
condiciones ambientales (favorable y desfavorable) del sistema de
aplicación aérea y terrestre en una distancia de 200 metros considerando un
movimiento perpendicular de la deriva con relación a la dirección de
aplicación.
Under Unfavorable
conditions, terrestrial spraying provided a higher droplet density than
aerial spraying at 20, 40, and 80 m. Beyond 80 m, aerial spraying promoted
higher droplet density, while terrestrial spraying had null density. Different
droplet density between climatic conditions in aerial spraying was only
observed at 80 m (figure
3b).
Climatic conditions strongly impacted terrestrial spraying with higher droplet
density under Unfavorable conditions compared to Favorable conditions
and from 20 to 100 m.
Target coverage values were below 1% for all spraying systems
and environmental conditions, (figure 4a and 4b).
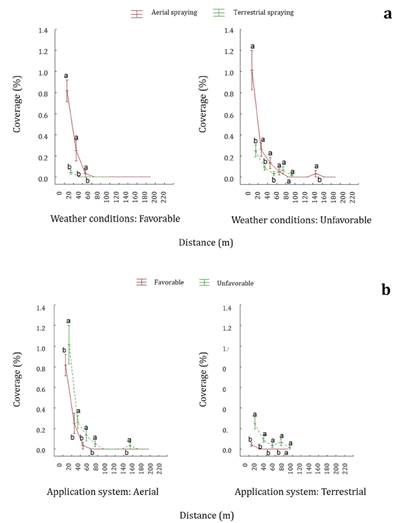
Lowercase letters
in figure 4a
differentiate the application systems at each distance evaluated for each
application condition. Lowercase letters in figure
4b differentiate the application conditions at each
distance evaluated for each application system.
Las letras
minúsculas en la figura 4a
diferencian los sistemas de aplicación en cada distancia evaluados para cada
condición de aplicación. Las letras minúsculas en la figura
4b diferencian las condiciones de aplicación
en cada distancia evaluada para cada sistema de aplicación.
Figure
4. Coverage (%) obtained by applications in two
environmental conditions (favorable and unfavorable) from the aerial and
terrestrial application system over a distance of 200 meters considering a
perpendicular movement of the drift concerning the direction of application.
Figura 4. Cobertura
(%) obtenida por aplicaciones en dos condiciones ambientales (favorable y
desfavorable) del sistema de aplicación aérea y terrestre en una distancia de
200 metros considerando un movimiento perpendicular de la deriva con relación a
la dirección de aplicación.
Aerial spraying provided higher coverage than terrestrial
spraying, for Favorable and Unfavorable conditions (figure
4a). Beyond 80 m, aerial coverage was below 0.1%, regardless of
climatic conditions. In terrestrial spraying, coverage below 0.1% occurred at
40 m from the target.
The maximum drift distance detected for ground application was
40 m and 90 m for Favorable and Unfavorable conditions,
respectively (table 2). For aerial application,
maximum drift values were 140 m and 180 m for Favorable and Unfavorable
conditions, respectively.
Table 2. Maximum
drift distance and increase thereof depending on applications carried out in
different modes and climatic conditions.
Tabla 2. Distancia
máxima de deriva y aumento de la misma en función de aplicaciones realizadas en
diferentes modos y condiciones climáticas.
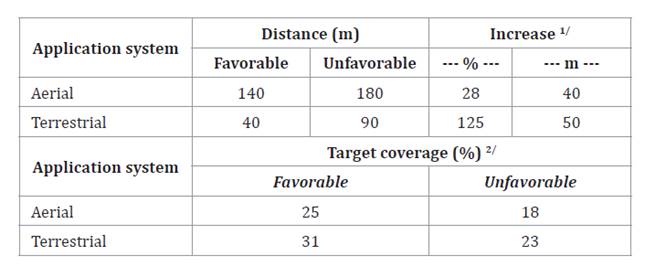
1/ Increase in drift when comparing
applications under ideal and adverse weather conditions. 2/ Target coverage provided on hydro-sensitive
papers positioned across the application swath.
1/ Aumento de la deriva al comparar aplicaciones en
condiciones climáticas ideales y adversas. 2/ Cobertura objetivo proporcionada en papeles
hidrosensibles colocados a lo largo de la franja de aplicación.
Discussion
Aerial spraying
showed higher drift potential in both Favorable and Unfavorable conditions.
Even terrestrial application had larger VMD (coarse droplets) than aerial
spraying (fine droplets), it did not reach greater distances outside the
target. The shorter distance to the target and the lower traveling speed
reduced lateral movement of larger droplets, allowing only lateral movement of
droplets with VMD under 50 μm in Favorable conditions and 75 μm for Unfavorable
conditions. Droplets of this caliber are more susceptible to wind drag,
even under ideal climatic conditions.
Even though aerial
spraying produced a spectrum of finer droplets, the higher target distance,
travel speed, and turbulence propelled larger droplets farther from the
application point. Probably, the smaller droplets of the aerial system
evaporated before reaching the hydro-sensitive papers. On the other hand,
larger droplets have a longer lifetime (2, 21) and were
transported by the wind to distances exceeding 120 m under Favorable conditions
and 180 m under Unfavorable conditions. Droplets with VMD greater than
100 μm are less susceptible to wind transport. However, for aerial spraying,
125 μm drops deposition was up to 60 m from the target under Unfavorable conditions.
Under Favorable conditions, drops with VMD greater than 100 μm were
transported up to 40 m given wind speed. According to Baio et
al. (2019), wind is the most influential factor in pesticide drift for
aerial spraying.
The higher droplet
density observed for terrestrial spraying under Unfavorable conditions
at 20, 40, and 80 m was given by smaller droplets traveling longer distances.
For up to 80 m from the target, the higher wind speed under Unfavorable conditions
was the prime factor modulating droplet movement. However, the lower position
of the application bar compared to aerial spraying minimized drift potential
with drops recorded only up to 80 m. Several studies directly correlate target
distance with drift potential (12, 17, 18). In addition,
aerial spraying occurred at 3 m from the target (3 m) while terrestrial
spraying was at 0.5 m, increasing average time for droplets to reach the
target. Probably, these droplets evaporated under Unfavorable conditions,
failing to reach water-sensitive papers after the target. Under Favorable conditions,
aerial spraying showed smaller droplets reaching the water-sensitive papers
with higher droplet density than terrestrial spraying.
Even though drift occurred at 90 and 180 m for terrestrial and
aerial spraying, respectively, under Unfavorable conditions, the amount
of active ingredient hypothetically reaching non-target areas, is low.
Coverage was less
than 0.1% for both spraying systems under this condition, proportionally low
when considering target average coverage of aerial and terrestrial spraying of
18% and 23%, respectively (table
2).
The hypothetical dose reaching above 90 m would be 0.5% and 0.4% of the
recommended dose for aerial and terrestrial spraying, respectively. However,
some non-target organisms do not tolerate infinitesimally small doses of
certain pesticides, such as dicotyledonous plants (3) or crayfish (24).
In general, higher temperature, lower relative humidity, and
increased wind speed during both aerial and terrestrial spraying increased
drift potential, with 28% and 125% for perpendicular and parallel distances to
wind direction. Despite higher drift risk of aerial spraying, terrestrial
spraying is strongly affected by environmental conditions. Under Unfavorable
conditions, drift reached 90 m, exceeding the minimum 50 m distance
established by Brazilian Law 19.423/2016 for areas with isolated dwellings and
groups of animals. Considering other restrictions determined by Brazilian Law
19.423/2016, even under non-ideal conditions, terrestrial spraying proved safe.
Under Favorable conditions, aerial spraying had a low drift risk, with
maximum drift detected at 140 m, under the 250 m limit established by law.
Conclusions
The results indicate that pesticide drift in large crops is
significantly influenced by spraying systems and environmental conditions.
Aerial spraying shows a higher drift potential, reaching over 180 m, while
terrestrial spraying under unfavorable conditions is limited to 90 m. System
choice should consider droplet size and specific environmental conditions.
Despite drift potential, coverage in non-target areas was under 0.1% for both
systems. We highlight the importance of rigorous safety laws to minimize
contamination, contributing to safer and more efficient agricultural practices.
Acknowledgements
To the Rural Union
of Rio Verde (Sindicato Rural de Rio Verde) for providing all the necessary
infrastructure to carry out the experiment.
The Universidade de Rio Verde (UniRV) for providing financial
resources to cover the costs of the analyses.
1. Antuniassi, U.
R.; Baio, F. H. R. 2008. Tecnologia de aplicação de defensivos. In.: Vargas,
L.; Roman, E. S. Manual de manejo e controle de plantas daninhas. Passo Fundo:
Embrapa Trigo. 173-212.
2. Baio, F. H. R.;
Antuniassi, U. R.; Castilho, B. R.; Teodoro, P. E.; Silva, E. E. D. 2019.
Factors affecting aerial spray drift in the Brazilian Cerrado. PLoS One.
14(2): e0212289.
3. Bish, M.;
Oseland, E.; Bradley, K. 2021. Off-target pesticide movement: a review of our
current understanding of drift due to inversions and secondary movement. Weed
Technology. 35(3): 345-356.
4. Burin, F.; Alves
de Souza, C. M.; Ramires, I.; da Silva, P. V. 2022. Physical-chemical
properties of spray syrup in tank-mixing multiple pesticides and water sources
used in grain farming. Revista de la Facultad de Ciencias Agrarias. Universidad
Nacional de Cuyo. Mendoza. Argentina. 54(1): 132-144. DOI: https://doi.org/10.48162/rev.39.072
5. European
Commission. Eurostat Database. Pesticide Sales. 2016.
http://appsso.eurostat.ec.europa.
eu/nui/show.do?dataset=aei_fm_salpest09&lang=en (Accessed in: 2023-Oct-30).
6. Ferguson, J. C.;
O’Donnell, C. C.; Chauhan, B. S.; Adkins, S. W.; Kruger, G. R.; Wang, R.;
Hewitt, A. J. 2015. Determining the uniformity and consistency of droplet size
across spray drift reducing nozzles in a wind tunnel. Crop Protection. 76(10):
1-6.
7. Ferreira, D. F.
2019. SISVAR: a computer analysis system to fixed effects split plot type
designs. Brazilian Journal of Biometrics. 37(4): 529-535.
8. Food and
Agriculture Organization of the United Nations. FAOSTAT database. Pesticides
use. 2016. http://www.fao.org/faostat/em/#data/RP (Accessed in: 2023- Oct-30).
9. Gelain, I. O.
2020. A regulação do agrotóxico e seu impacto na produção vitivinícola no Rio
Grande do Sul. https://repositorio.unisc.br/jspui/handle/11624/3034 (Accessed
in: 2023- Oct-30).
10. Gentil-Sergent,
C.; Basset-Mens, C.; Gaab, J.; Mottes, C.; Melero, C.; Fantke, P. 2021.
Quantifying pesticide emission fractions for tropical conditions. Chemosphere.
275(15): 130014.
11. Gil, E.; Balsari, P.; Gallart, M.; Llorens, J.; Marucco, P.;
Andersen, P. G.; Llop, J. 2014. Determination of drift potential of different
flat fan nozzles on a bar sprayer using a test bench. Crop protection. 56(2):
58-68.
12. Grella, M.;
Miranda-Fuentes, A.; Marucco, P.; Balsari, P. 2020. Field assessment of a
newly-designed pneumatic spout to contain spray drift in vineyards: evaluation
of canopy distribution and off-target losses. Pest Management Science. 76(12):
4173-4191.
13. Interfase. CIR
1.5: Software para análisis de espectro de pulverización. 2023. http://www.
interfasetres.com.ar/producto/pulverizacion/software-cir15 (Accessed in: 2023-
Oct-30).
14. Jacquet, F.;
Jeuffroy, M. H.; Jouan, J.; Le Cadre, E.; Litrico, I.; Malausa, T.; Reboud, X.;
Huyghe, C. 2022. Pesticide-free agriculture as a new paradigm for research.
Agronomy for Sustainable Development. 42(8): 1-24.
15. Jones, G. T.;
Norsworthy, J. K.; Barber, T. 2019. Off-target movement of diglycolamine
dicamba to non-dicamba soybean using practices to minimize primary drift. Weed
Technology. 33(1): 24-40.
16. Lykogianni, M.;
Bempelou, E.; Karamaouna, F.; Aliferis, K. A. 2021. Do pesticides promote or
hinder sustainability in agriculture? The challenge of sustainable use of
pesticides in modern agriculture. Science of the Total Environment. 795(11):
148625.
17. Mello, C. E.;
do Carmo, E. L.; Braz, G. B.; Procópio, S. D. O.; Simon, G. A.; Souza, M. D.
F.; Araújo, G. E. S.; Lins, H. A. 2024. Application rate and nozzles associated
with droplet electrification affect the spraying quality in common bean.
Brazilian Journal of Agricultural and Environmental Engineering. 28(2):
e273814.
18. Musiu, E. M.;
Qi, L.; Wu, Y. 2019. Spray deposition and distribution on the targets and
losses to the ground as affected by application volume rate, airflow rate and
target position. Crop Protection. 116(2): 170-180.
19. Nascimento, E.;
Zago, A. 2013. Agricultural plane flies over school and poisons dozens of
children, in GO.
https://g1.globo.com/goias/noticia/2013/05/aviao-agricolasobrevoa-escola-e-intoxica-dezenas-de-criancas-em-go.html
(Accessed in: 2023-Oct-30).
20. Nuyttens, D.;
Zwertvaegher, I. K.; Dekeyser, D. 2017. Spray drift assessment of different
application techniques using a drift test bench and comparison with other
assessment methods. Biosystems Engineering. 154(2): 14-24.
21. Oseland, E.;
Bish, M.; Steckel, L.; Bradley, K. 2020. Identification of environmental
factors that influence the likelihood of off-target movement of dicamba. Pest
Management Science. 76(9): 3282-3291.
22. Sabzevari, S.;
Hofman, J. 2022. A worldwide review of currently used pesticides’ monitoring in
agricultural soils. Science of The Total Environment. 812(3): 152344.
23. Thornthwaite,
C. W. 1948. An approach toward a rational classification of climate.
Geographical Review. 38(1): 55-94.
24. Uçkun, A. A;
Öz, Ö. B. 2021. Evaluation of the acute toxic effect of azoxystrobin on
non-target crayfish (Astacus leptodactylus Eschscholtz, 1823) by using
oxidative stress enzymes, ATPases and cholinesterase as biomarkers. Drug and
Chemical Toxicology. 44(5): 550-557.
25. US Geological Survey. 2016. USGS NAWQA: The pesticide
National Synthesis Project. Estimated annual agricultural pesticide use.
https://water.usgs.gov/nawqa/pnsp/usage/maps/ county-level/ (Accessed in:
2023-Oct-30).
Supplemmentary
material