Revista de la Facultad de Ciencias
Agrarias. Universidad Nacional de Cuyo. Tomo 57(1). ISSN (en línea) 1853-8665.
Año 2025.
Original article
Water
quality assessment of streams and rivers for irrigation in Southern Continental
Patagonia
Evaluación
de la calidad del agua para irrigación en ríos y arroyos de la Patagonia
Austral Continental
Adrián J. Acuña2,
Leandro R.
Almonacid3,
M. Fernanda Gaspari4,
Mariano Bertinat5,
Ornella Bertoni2,
Pablo L. Peri6
1 Universidad Nacional de la Patagonia Austral (UNPA). Instituto
Nacional de Tecnología Agropecuaria (INTA) EEA Santa Cruz. Argentina. Mahatma
Gandhi 1322 (CP9400). Río Gallegos. Argentina.
2 Laboratorio Regional de Investigación Forense. Pellegrini 415
(Z9400AQG). Río Gallegos. Argentina.
3 Municipalidad de Río Gallegos. INTA CR Patagonia Sur.
4 Universidad Nacional de la Plata (UNLP). Facultad de Ciencias
Agrarias y Forestales. Avda. 60 y 119 s/n (CP1900) La Plata. Argentina.
5 Secretaría de Estado de Ambiente de Santa Cruz. Elcano 260
(Z9400JGF). Río Gallegos. Argentina.
6 Universidad Nacional de la Patagonia Austral. CONICET.
*diaz.boris@inta.gob.ar
Abstract
This work aimed to
analyze and classify the suitability of freshwater sources for irrigation in
three large hydrographic regions of Southern Continental Patagonia: Coyle,
Serrano, and Gallegos. In these regions, there is a lack of information on the
irrigation suitability of surface waters. For this, 74 surface water locations
were sampled from 42 watercourses in Santa Cruz province and Magallanes region
in Argentina and Chile, during dry and wet seasons between 2017 and 2019. The
concentration of ions of agricultural interest was evaluated in the laboratory.
The pH ranged between 6.1-9.5 with little seasonal variability. The prevailing
ions were Ca2+ Mg2+ and HCO3-,
while the lower cation concentration was K+.
The Sodium Adsorption Ratio was 0.58 ± 0.21 during winter and 0.46 ± 0.15 in
summer. Most waters in the region have electrical conductivity values below 250
μS/cm and may be categorized as low-salinity waters. We determined no significant
hazards for crops, vegetables, and pasture production in terms of the combined
salinity and sodicity indicators. However, a potential negative impact on soil
structural stability mainly due to Na+ concentration must be
considered for the implementation of suitable irrigation projects.
Keywords: agriculture,
hydrochemistry, hydrology
Resumen
En este trabajo se
analizó y clasificó la aptitud de fuentes de agua para riego en tres regiones
hidrográficas de la Patagonia Austral (Argentina): Coyle, Serrano y Gallegos.
Estas regiones carecen de antecedentes sobre la aptitud de sus aguas para la
irrigación. A fin de proporcionar esta información, se analizaron en
laboratorio muestras de aguas superficiales de 74 locaciones en 42 cursos de la
provincia de Santa Cruz en Argentina y de la región de Magallanes en Chile,
durante las estaciones seca y húmeda del año, entre 2017 y 2019. Se evaluó la
concentración de cationes y aniones de interés agrícola. Las aguas mostraron un
rango de pH entre 6,1 y 9,5 con poca variabilidad estacional. Los cationes
predominantes fueron Ca2+ y Mg2+ y menor en K+, siendo HCO3-
el principal anión. El SAR se encontró entre 0,58 ± 0,21 durante
el invierno y 0,46 ± 0,15 en verano. Con excepción de algunas muestras, la
mayoría de las aguas tienen valores de conductividad eléctrica inferiores a 250
μS/cm y pueden catalogarse como aguas de baja salinidad. No se detectaron
peligros significativos para la producción de cultivos, hortalizas y pastos en
términos de los indicadores combinados de salinidad y sodicidad. Sin embargo,
existe un potencial impacto negativo en la estabilidad estructural del suelo
debido principalmente a la concentración de Na+ que debe tenerse en
cuenta para la implementación de proyectos de riego.
Palabras clave: agricultura,
hidroquímica, hidrología
Originales: Recepción: 29/02/2024 - Aceptación: 23/10/2024
Introduction
Patagonia occupies
a vast territory in southern Argentina and Chile. This includes various
heterogeneous ecological areas, mainly because of the diverse edaphoclimatic
characteristics that determine the predominance of arid, semi-arid, and very
arid bioclimatic zones (1). The grassy and
shrub steppes on plateaus and glaciofluvial valleys represent the main features
of the landscape. The main socioeconomic activities are extensive sheep and
cattle farming and agriculture in irrigated valleys. These environments have
been enduring constant degradation for little more than a century since the
initial European settlement at the end of the 19th century. This process
still occurs mainly because of the combination of poor agricultural management
practices, livestock overgrazing, and recurrent drought events. In this
context, plant communities and agro-productive activities are severely limited
by water deficit.
Consumptive use for
agricultural production represents the greatest demand for freshwater in the
world, with an estimate of 70% globally by 2020 (27) and in Argentina (10). This use is also
one of the most inefficient due to overexploitation, lack of reuse, contamination
with agrochemicals, low irrigation efficiency, and flooding (24).
Irrigating natural
grasslands in river valleys of Southern Patagonia has exerted increasing
pressure on the consumptive use of surface water, mainly due to the frequent
drought events in recent decades. In arid and semi-arid regions of Patagonia,
this practice can significantly improve natural grass yields up to 10-20 times,
mainly in wetlands (4). Irrigation to
supplement the rainfall in the warm months and the snow melting in early spring
arises as an alternative during critical stages of the grasslands growing
season and cultivated pastures (15) in traditional dry
farming lands. However, irrigation may produce negative environmental impacts.
Soil sodicity, salinity or ion toxicity caused by poor management irrigation
practices in hazardous situations (25) are some of the
greatest environmental pressures of agriculture worldwide (11). Because of these
potential negative effects, it is important to better understand of how water
quality influences the management of irrigated agriculture.
Successful
irrigation projects involve appropriate quantification and distribution of the
required water and adequate control of its quality (5,
11, 25). Currently, only salinity and sodicity hazards combined have
caused 23.5% of the total land degradation by irrigation in Argentina, which
represents 500.000 ha (9). Therefore,
regular monitoring of water quality for irrigation in this region becomes
relevant to support decisions on sustainable use, management, and conservation
of both water and soil (15). Although there
has been considerable interest in this topic around the globe, there is a lack
of studies in Patagonia.
In this study, we
analyze and classify the suitability of freshwater sources for irrigation in
the southernmost region of the Southern Continental Patagonia. It was carried
out from a set of widely used indicators for the detection of sodicity and
salinity hazards. We analyzed 148 surface water samples from 42 watercourses in
the Santa Cruz province (Argentine) and Magellan region (Chile) during the dry
and wet seasons between 2017 and 2019. We evaluated the following indicators:
Sodium Adsorption Ratio (SAR), adjusted SAR, Residual Sodium Carbonate, Soluble
Sodium Percentage, Standardized Electrical Conductivity, Total Dissolved
Solids, Effective Salinity and Potential Salinity.
Materials
and methods
Study
site
The study area focused on three major hydrographic regions (HR)
in Southern Continental Patagonia, covering 57,406.4 km2 of which 76.1 % is
located in Argentina, and 23.9% in Chile (figure 1).
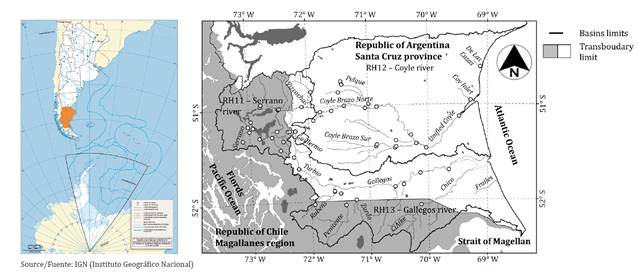
Figure 1. Sampling
sites in rivers, streams, and creeks of Southern Continental Patagonia.
Figura
1. Sitios de muestreo en ríos y
arroyos de la Patagonia Austral Continental.
The first region, the Serrano River basin (HR11), covers 8,638.8
km2 with 23.6% located in
Argentina, in the upper basin (6). This
transboundary system with a predominantly nivo-glacial mixed regime drains into
the Pacific Ocean, exhibiting an average annual flow of 2,964.3 hm3. About 164.0 hm3/year (5.5%) is
produced in the Argentine side. The second region, the Gallegos River basin
(HR13), is another transboundary territory that flows into the Atlantic Ocean,
with an extension of 19,289.1 km2,
with 63.2 % in Argentina. It also has a predominantly nivo-pluvial mixed flow
regime and produces an annual surface runoff of slightly over 1,000 hm3. The last region,
the Coyle River basin (HR12), extends across 29,424.0 km2 exclusively in Argentina.
Characterized by a mainly nival flow regime it produces an annual runoff of
39.9 hm3.
Data
collection and analysis of Argentine waters
In Southern
Patagonia, the main demand for complementary irrigation of crops, pastures, and
natural grasslands occurs between late winter and early spring (September and
October, corresponding to a wet season for HR12 and HR13, and a dry season for
HR11) and late summer (February and March). Fifty-five surface water samples
from different locations along 28 watercourses in the Santa Cruz province were
collected during the dry and wet seasons. A total of 110 samples were obtained
between 2017 and 2019 (figure
1).
Both sampling moments represent opposite moments of the annual hydrograph.
Watercourses were
classified as permanent, intermittent, or ephemeral types according to their
annual discharge and the percentage of annual exposure of the channel bed (23). We used a
quantitative watercourses classification adapted from Jowett
(2020)
to contextualize and facilitate the interpretation of results: creeks (mean
annual discharge <1 m3/s),
streams (<5 m3/s),
and rivers (>5 m3/s).
On-site equipment
handling procedures, water sampling methods, conditioning for conservation and
transport were implemented in accordance with the protocols for water quality
sampling suggested by USGS (26). The concentration
of ions of agricultural interest was evaluated in the laboratory. Sodium (Na+) and Potassium (K+) were determined
by flame photometry according to standards SM-3500-Na B and SM-3500-K B.
Calcium (Ca2+) and
Magnesium (Mg2+)
were analyzed by complexometric titration with EDTA at pH 12 using murexide as
the indicator for the first case, and at pH 10 with Eriochrome®
Black T for the second, according to standard SM-2340-C. The
presence of Chloride (Cl-)
was determined through the standard SM-4500-Cl-
B; Sulfate (SO42-) through precipitation
with Barium and by turbidimetry monitoring according to SM-4500-SO4-2 E standard. Carbonate (CO32-)
and Bicarbonate (HCO3-)
were determined through titration with 0.1 N hydrochloric acid using phenolphthalein
and helianthin as indicators, according to standard SM-2320 B. The pH and
specific electrical conductivity -ECw- were determined in situ according
to SM-4500-H+ B and SM-2510 B
standards, through a calibrated portable probe. The total dissolved solids
(TDS) were determined through a gravimetric method on the dry residue according
to the SM-2540 C standard.
Data
collection and analysis of Chilean waters
Water quality data
publicly available from the Chilean governmental authority (7) was used for 14
creeks, streams, and rivers in 19 different locations, in the same time periods
sampled in the Argentine sector. Major cations (Na+,
K+, Ca2+, and Mg2+) were determined
by atomic absorption spectroscopy according to the standard SM-3111 B. The
anions Cl-, SO42-,
CO32-, and HCO3-, the pH and EC
were determined through the same procedures used for the Argentine samples.
Data
processing and water quality analysis
All 148 water
samples analyzed in the present work (55 from Argentina + 19 from Chile, for
each season) showed less than 5% absolute average error in the
electroneutrality condition from major ion concentrations. Water types were
classified according to their chemical composition and dynamics based on Piper (21).
Four indicators were used to evaluate the sodium hazard. First,
the Sodium Adsorption Ratio (SAR), widely used for the suitability of typical
irrigation waters (14, 31), constitutes a
strong predictor of the soil exchangeable sodium percentage (11,
30). This standard SAR equation was adjusted (SARadj)
when alkaline waters contained relatively high concentrations of Mg2+, Ca2+
as well as carbonates (CO3-2) and bicarbonates
(HCO3-). This
situation could raise the relative proportion of Na+ in solution
concentrations after precipitation of carbonate salts with Ca2+ and Mg2+ (3,
8, 12, 14, 25, 31), particularly in soils of arid environments subject to high evapotranspiration
or evaporation rates (1). Weiner
(2013)
suggests the application of SARadj to water samples with
>200 mg/l HCO3 and pH>8,5. Among
different approaches for its calculation, we used one suggested by Lesch
and Suarez (2009). A third indicator used was the Residual Sodium Carbonate
(RSC), defined by Eaton
(1950).
Finally, we used the Soluble Sodium Percentage (SSP) to complement the SAR.
This is useful for characterizing water hardness (30) to anticipate the
long-term negative effects of Na+ on
the soil (22).
Four indicators
were used to evaluate the salinity hazard. First, the Standardized Electrical
Conductivity -ECw- (in μS/cm) and Total Dissolved Solids -TDS- (in mg/l) were
analyzed. Both are highly correlated with the total concentration of soluble
salts (31) and, consequently, widely used for
the interpretation of the saline hazard in irrigation waters (30). Even in terms of
potential sodicity hazard, SAR is best interpreted when analyzed together with
ECw (14). Second, the Effective Salinity (ES)
defined by Marín
et al. (2002), is useful when some less soluble salts precipitate in the form
of carbonates or sulfates in contact with the soil. Under such circumstances,
ECw tends to overestimate the impact of the real salinity. Finally, the
Potential Salinity (PS) indicator was used. This is often recommended when soil
moisture content drops below 50%, and chlorides and sulfates are the last salts
to remain in solution (16, 20). This is a common
situation in the summer for Southern Patagonian environments.
The results were
analyzed using arithmetic means and standard deviations in different sample
groupings, according to hydrographic regions. The Shapiro-Wilks normality test
(p<0.05) was conducted before the arithmetic analysis. Specific
relationships were established between analytical results and seasonal flows by
Pearson’s linear correlation coefficient at p<0.05.
Results
and discussion
Descriptive
analysis
Water temperature
plays a critical role in numerous physical and chemical processes essential for
the aquatic environment including gas and some ionic compounds solubility,
biodegradability of substances, toxicity of chemicals, metabolic activity,
nutrient cycles, and primary production (28). During the
sampling campaigns, the mean water temperature ranged between 4.9 and 7.6°C in
winter and 8.2 to 11.5°C in summer (table 1).
Table 1. Statistics
for salinity and sodicity hazard indicators obtained from the analysis of
surface water samples in the most important courses of the Serrano (HR11),
Coyle (HR12), and Gallegos (HR13) river basins, between 2017 and 2019.
Tabla
1.
Estadísticos de indicadores de riesgo de salinidad y sodicidad obtenidas del
análisis de muestras de aguas superficiales en los cursos más importantes de
las cuencas de los ríos Serrano (HR11), Coyle (HR12) y Gallegos (HR13), entre
2017 y 2019.
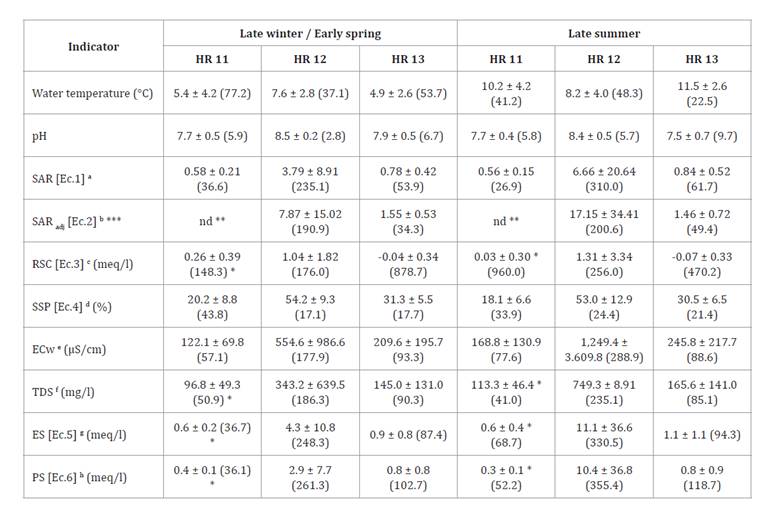
Data are presented as mean values
± standard deviation and the percentage of variation coefficient between
brackets.
a Sodium Adsorption Ratio; b Adjusted
Sodium Adsorption Ratio; c Residual Sodium Carbonate; d Soluble Sodium Percentage; e Specific Electrical Conductivity; f Total
Dissolved Solids; g Effective
Salinity; h Potential
Salinity; * Only valid cases in the Argentine sector due to
unavailable data from the Chilean sector in transboundary basins HR11 and HR13.
** No data in range for calculation (HCO3 >200 mg/l). *** Only cases with
HCO3 >200
mg/l.
Los datos se presentan como
valores medios ± desviación estándar y el coeficiente de variación porcentual
entre paréntesis.
a Relación Adsorción de Sodio; b Relación Adsorción de Sodio ajustada; c Carbonato de Sodio
Residual; d Porcentaje de Sodio Soluble; e Conductividad Eléctrica Específica; f Sólidos Totales
Disueltos; g Salinidad Efectiva; h Salinidad Potencial; * Solo casos válidos en el sector argentino debido a faltante
de datos en el sector chileno en las cuencas transfronterizas RH11 y RH13. ** Sin datos en el rango
de cálculo sugerido (HCO3 >200 mg/l). *** Solo casos con HCO3 >200 mg/l.
Extreme values
ranged from 0.2 to 14.8°C during winter, with the lowest values occurring in
the mountain range (HR11 and southwestern HR12). In contrast, summer water
temperatures ranged from 2.1 to 19.9°C, with the highest values found in small
creeks and streams in the center of the HR12 and HR13 basins.
Another major
controlling variable of chemical processes in aquatic environments is pH (28). All regional
waters showed a pH range between 6.1 and 9.5 with little seasonal variability
and without a relationship with their flow regimes or annual discharge. The
proximity to the western mountain range narrowed pH values to 7.7-7.9 in
streams and rivers of the HR11 and tributaries in the upper watersheds of the
HR13 basin. Waters become slightly more alkaline in HR12 and eastern watersheds
of the HR13 basin (for example in intermittent Los Frailes and ephemeral Coy
Inlet streams), with a pH range of 8.1-9.4.
The prevailing
cations in waters of the three large hydrographic regions (HR) were Ca2+
and Mg2+ with a slight dominance
of the former (figure
2).
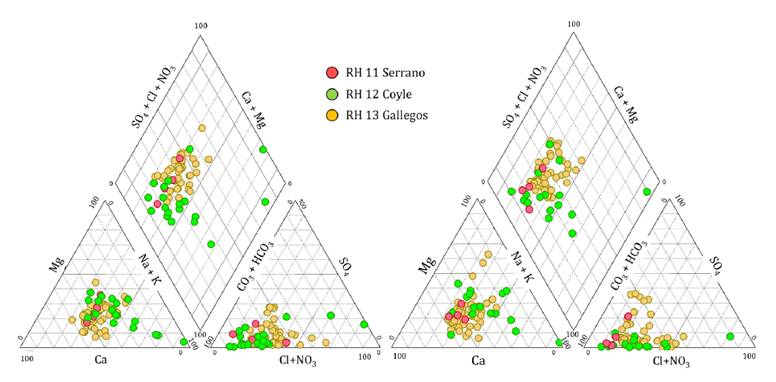
Figure
2. Piper diagram for winter waters (left) and summer
waters (right).
Figura
2. Diagrama de Piper para muestras de
agua de invierno (izquierda) y de verano (derecha).
Na+ had similar
concentrations to Mg2+ in HR11, prevailing only
in a few cases, as in the Don Guillermo stream (concentration over 25.0%
between major cations when expressed in meq/l). The lowest concentration
between cations was K+,
with a mean value of 3.8% in meq/l in winter and 2.4% in summer. This
distribution of proportions among cations is consistent with most rivers in the
world (17). HCO3-
was the predominant cation resulting in the Ca(Mg)
HCO3 water type in the
Argentine side of HR11 (figure
2).
Data was insufficient for such analysis in the Chilean side of this basin.
Except for Cl-,
the average concentrations of different ions tend to be slightly lower during
summer compared to winter, with the occurrence of annual peak flows in HR11. In
both seasons the proportions of these ions tend to remain unchanged. As stated
by Mosley
and Row (1981), this suggests the dilution of solutes by run-off and a
relatively low concentration of elements contributed by the subsurface flow.
This process can be associated with a faster transit of rainwater toward the
waterways in the wet season without interacting with soil solutes. This is
particularly evident in creeks and streams, rather than rivers.
Also, in HR13, most
of the waters did not have a prevalent cation between Ca2+ and Mg+2.
Na+ was the second most
important cation (30.5 and 31.1% in meq/l for winter and summer, respectively)
while Mg2+ occupied the third place
(22.7 and 23.6% in meq/l for winter and summer, respectively). Few samples
showed a dominance of chlorinated water type in both seasons. This occurred,
mainly, in small steppe creeks and streams near the seacoast, like in Ci-Aike
(over 40% in meq/l Cl-)
and Los Frailes (over 50% in meq/l Cl-),
both of intermittent stream type (figure 2). A similar pattern of concentrations occurred with the
remaining anions without seasonal variation, in which the bicarbonate type
dominated. The hydrochemical facies of these waters are a combination of the Ca(Mg)HCO3 type and a mixed type (figure 2).
There was no
dominant type among the cations in HR12 samples. However, Na+ was the most prevalent
(over 40.0% in meq/l), followed by Ca2+ (between 30.9 and 31.9%
in meq/l) and Mg2+ (23.1 and 26.0% in
meq/l). There was a tendency for Na+ to prevail in short
ephemeral coastal watercourses towards the east of this HR, with extreme values
of 74.7% in meq/l in De Las Casas and 94.1% in meq/l in Coy Inlet. Bicarbonate
waters are dominant in this region which determined the existence of facies
mainly of the Ca(Mg)HCO3 type and the Na(K)HCO3
mixed type (figure
2).
Only few samples were corresponded to a chlorinated type.
Although large
rivers cross the extensive Patagonian steppes, like Coyle and Gallegos, with a
high evapotranspiration rate during summer, there was no evident change in ion
concentrations along river courses to the sea. Likewise, there is no clear
dominance of Ca2+ or Mg2+ in the upper basins or
tributaries. This suggests a relatively uniform lithology along watercourses
that determines a homogeneous distribution of major element concentrations (17).
Sodicity
(alkali) hazard
The soluble salts present in the soil or in the irrigation water
contribute to the increase the salinity of the soil solution. Similarly, when
these salts involve exchangeable Na+,
they contribute to the increase of Na+ relative saturation,
given its more persistent nature in soils (25). Excess of sodium
salts represents a toxicity hazard for sensitive plant species, it negatively
affects the soil permeability and hydraulic conductivity and, therefore, it
alters soil structure aggregation with the consequent unavailability of water
for crops intake (15, 31). Na+ hazard in soils is more
complex to establish than the water sodicity hazard because of several
interacting factors, such as soil texture (28), electrical
conductivity, and rate of sodium adsorption during soil watering (25).
Serrano (HR11) and Gallegos (HR13) regions exhibited lower
levels of SAR than Coyle (HR12). In HR11, the mean SAR ranged from 0.58 ± 0.21
during late winter and 0.56 ± 0.15 in summer (table 1). This is a small
difference despite the contrasting seasonal flows in rivers and streams, which
can reach mean annual values as low as 0.01 - 2.0 m3/s
(Don Guillermo and Chorrillo streams) and 2.5 - 30.0 m3/s
(Vizcachas, Baguales, Las Chinas and Paine rivers) or higher, up to 120.0 -
380.0 m3/s (Grey and
Serrano rivers), all of them being of permanent type. The only extreme values
were observed in Don Guillermo stream waters with SAR ranging between 0.92 and
1.06, depending on the season. Low mean SAR values were also found in HR13,
ranging from 0.78 ± 0.42 in winter and 0.84 ± 0.52 in summer, with a few
exceptions in the San José creek, a minor tributary located in the upper
portion of the system (SAR=2.40). Relatively high values were observed in Los
Frailes and Ci Aike creeks (SAR=2.61), which represent intermittent courses in
the eastern portion of HR13. Regardless of the ECw, these SAR values were always
located in the S1 category, which represents a low sodium hazard for irrigation
(figure
3)
(25,
31).
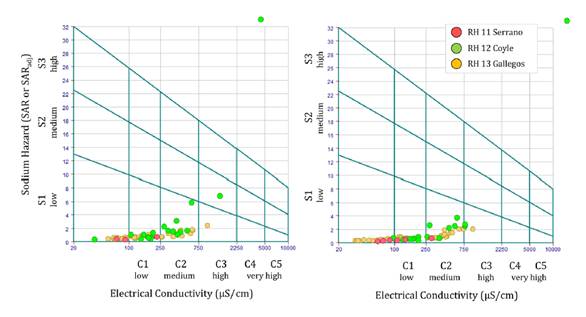
Figure 3. Salinity
and sodicity combined hazards in surface waters from the three HR in the winter
(left) and in the summer (right), through the Wilcox (1995)
plot.
Figura
3. Riesgos combinados de salinidad y
sodicidad en aguas superficiales de las tres RH, según el esquema de Wilcox (1995), durante invierno (izquierda) y verano (derecha).
HR12 showed the highest mean regional SAR values, with great
spatial variability. The average SAR ranged between 3.79 ± 8.91 for winter and
early spring and 6.66 ± 20.64 for summer, with spatial variabilities between
235 to 310%, respectively. The highest SAR values were recorded in the
ephemeral waters of Coy Inlet Creek, located at the mouth of the Coyle River,
where it meets the sea (39.9 and 83.9 for winter and summer, respectively), and
in the Fabre creek, located in the central section of HR12 (5.9 and 3.8 for
winter and summer, respectively). Coy Inlet creek water exhibited an extremely
high sodium hazard (>S4), exceeding the scale proposed by USDA (25). Furthermore, a
few streams such as the Fabre creek and the De Las Casas stream reached a
medium sodium hazard category S2 (figure 3). This condition, combined with fine-textured soils, high
cation exchange capacity, and restricted drainage, typical situations in this
region, represents a high risk for several crop species (31). Excluding these
extreme cases, the mean SAR of waters in this basin ranged from 1.55 ± 1.52 in
winter to 1.34 ± 0.94 in summer.
In general terms,
there were significant strong positive correlations between the mean season
flows and SAR values for HR11 and HR13. The predominant nivo-glacial mixed
regime type in HR11 rivers, streams, and creeks showed two hydrograph peaks
from late winter to mid-spring, and a maximum in late summer. In HR13, the
nivo-pluvial mixed flow regime presented two hydrograph peaks: one moderate
from late autumn to early winter, and a maximum from late winter to mid-spring.
In both cases, seasonal peak flows correlated with higher SAR values in terms
of m3/s
determined in gauging stations. For HR11, the correlation was 0.847 (r2= 0.717, p-value
<0.05) in 32 valid cases, while for HR13 correlation was 0.825 (r2= 0.681, p-value
<0.01) in 49 cases. A valid case consisted of the existence of a flow record
at the same site as a sample collection. No statistical significance was
detected for HR12 water samples between seasons (0.639, r2=
0.406, p-value=0.114). The predominantly nival regime produces a strong peak
flow between late winter to mid-spring, with minimum flows during the rest of
the year, and most creeks and small streams dry out during the warmest months.
No HR11 samples met
the requirements proposed by Weiner (2013) to implement the
SARadj. Although
the mean SARadj value was 25% higher in
water samples from HR13 with >200 mg/l HCO3 than the mean standard
SAR values both remained in the S1 sodicity hazard category. In HR12 water
samples SARadj emphasized the sodium
character of waters with high concentration of bicarbonates, especially in
creeks and streams such as Coy Inlet, Fabré, and De Las Casas, all of them
ephemeral types. The sodium hazard categories in these sites were between S2
and S4 (from high to very high), with extreme SARadj values up to 44.8 in
winter and 87.4 in summer, slightly above the standard SAR indicator. Despite
these cases, most samples were classified, in terms of SARadj,
within the S1 category (low hazard) with an average of 11% higher than standard
SAR values.
When irrigation
water contains enough carbonates and bicarbonates to precipitate Ca2+
and Mg2+ calcium and magnesium, a
small proportion of Na+ may be enough to cause
initial symptoms of soil sodification (8). Applying the
classification suggested by Wilcox et al. (1954), mean RSC values
less than 1.25 meq/l in both seasons and from the three hydrographic regions
determined that waters are safe for irrigation (table 1). HR12 waters
showed a mean RSC value of 1.04 ± 1.82 in winter and 1.31 ± 3.34 in summer.
However, Fabré creek, sections of Brazo Norte of Coyle river and the unified
Coyle river (convergence of all its tributaries in the HR12) had marginal
waters (between 1.25 and 2.5 meq/l). De Las Casas stream and Coy Inlet creek,
both of ephemeral type, showed RSC>2.5 meq/l, rendering them unsuitable for
irrigation.
Most waters in the
HR11 basin had SSP values below 35.0%, qualifying as good to excellent quality
for irrigation according to Wilcox (1955), with no potential
hazard for soil physical properties or plant growth (22). The average SSP
for these waters was between 20.2 ± 8.8% in winter and 18.1 ± 6.1 in summer (table 1), with an
exceptional SSP value of 53.5% in the lower Serrano river. A similar situation
was observed in HR13 (mean SSP of 31.3 ± 5.5 in winter and 30.5 ± 6.5 in
summer) and HR12 waters, which showed the highest mean SSP with 54.2 ± 9.3 in
winter and 53.0 ± 12.9 in summer (table 1). In both HR, most water samples qualified as good to
permissible for irrigation purposes. HR12 waters showed the highest SSPs
average in the region.
Salinity
hazard
Diagnosis and classification of the total concentration of
soluble salts in irrigation waters, may be adequately expressed in terms of ECw
(25,
30). Except for a few samples, most waters in the region had ECw
values below 250 μS/cm and may be categorized as low salinity waters (C1),
according to Wilcox
(1955).
Such waters can be used for crop irrigation in a great variety of soils without
great risks of developing salinity problems. This is particularly evident in
rivers and streams of HR11, with an average of 122.1 ± 69.8 μS/cm in winter,
and 168.8 ± 130.9 μS/cm in summer (table 1). Few cases in this basin, such as Don Guillermo (Argentine)
and Chorrillo (Chile) streams, showed higher sodium hazard levels up to the C2
category (ECw<750 μS/cm), (figure 3). This corresponds to medium salinity waters, which can be used
for irrigation of crops with moderate tolerance to salinity in soils with good
drainage (30). Increasing ECw levels tend to
mitigate negative sodium effects on soils but it can simultaneously induce crop
stress by degrading the quality of the available water via salinization (14).
Similarly, in HR13
waters mean ECw was 209.6 ± 195.7 μS/cm and 245.8 ± 217.7 μS/cm in winter and
summer, respectively. About 69% of samples were below 250 μS/cm in both seasons
(C1) and 28% were within C2 (<750 μS/cm) (figure 3). Los Frailes and
Ci Aike (two small intermittent streams in the final stretch of the HR13 near
the seacoast) and San José (a small creek of the permanent type in the upper
basin that receives strong discharges from extractive coal mining since the
1960s) reached a C3 category (from 750 to 2,250 μS/cm).
Coy Inlet and De
Las Casas intermittent streams, in HR12, were the only C4 waters in the region,
with an ECw of 4,440 and 14,760 μS/cm, a high salinity not suitable for
irrigation of intolerant crops. Excluding these sections from a global
analysis, mean ECw values in this basin ranged from 276.9 ± 160.8 μS/cm in
winter to 348.7 ± 232.7 μS/cm in summer (table 1), qualifying
closer to HR11 and HR13 waters although slightly higher. A 48.6% water of
samples from H12 were C1, 37.1% were C2 and 8.6% were C3 (figure 3).
The relationship
between sodicity and salinity hazards is more complex in soil than in water.
While increasing salinity and sodicity in water involve crop irrigation
restrictions, the long-term negative impact on soil occurs when increasing
sodicity coincides with decreasing salinity (3,
25, 30). High Na+ concentration leads to
soil sodicity, increasing the susceptibility to crusting, runoff, erosion, and
poor aeration, as well as the deterioration of soil hydraulic properties which
can be counteracted with increasing salinity (21).
In contrast to the relatively low sodium hazard of waters for crop
irrigation, the SAR analysis indicates an important potential for negative
impacts on soil stability. In general, most water samples were found at the
likely permeability hazard threshold based on the SAR/ECw relationship (figure 4).
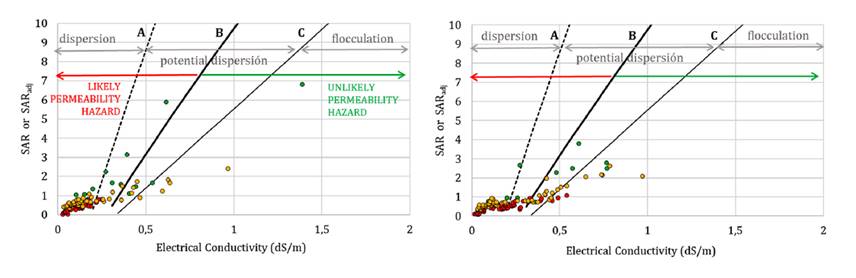
Figure
4. Relationship between SAR and ECw of irrigation water
for prediction of soil structural stability in the three HR during late winter
and early spring (left) and late summer (right). Adapted from ANZECC and ARMCANZ (2000)
and Feitz and Lundie (2002).
Figura
4. Relación entre SAR y ECw en agua de
riego para la predicción de la estabilidad estructural del suelo en las tres
RH, entre fines de invierno y principio de primavera (izq.) y finales del verano
(der.). Adaptado de ANZECC
and ARMCANZ (2000) y Feitz and Lundie (2002).
During early spring, with the beginning of complementary
irrigation season, 100% of water samples in HR11, 89.5% in HR12, and 90.2% in
HR13 demonstrated a possible permeability hazard. More than 50.0% of the total
water samples in the region were under the curve of high risk of dispersion
probability (curve A). During summer, the HR12 waters maintained a similar
proportion of samples in the potential (likely) probability hazard category
(89.5%), with a slight decrease in the samples from HR11 (91.2%) and HR13
(84.3%).
There were
statistically significant strong positive correlations between seasons and the
ECw for both HR11 and HR13, with higher values during summer. In the case of
HR11, the correlation value was 0.693 (r2=
0.481, p-value <0.01) and for HR13, correlation was 0.819 (r2=
0.671, p-value <0.01). No statistical significance was detected for HR12
water samples between seasons despite a high correlation coefficient (0.847, r2= 0.717,
p-value=0.128).
The average ES
values for the HR11 and HR13 samples were 0.6 ± 0.2 meq/l and 0.9 ± 0.8 meq/l
respectively, during late winter and early spring, and 0.6 ± 0.4 meq/l and 1.1
± 1.1 meq/l during summer (table
1).
Except for Los Frailes and Ci Aike (lower HR13) and San José (upper HR13) with
some seasonal sodicity and salinity restrictions, the effective salinity hazard
was low for all the remaining water samples (ES<3 meq/l), according to Palacios
and Aceves (1970). ES values in these cases were not particularly high (ES<5
meq/l), but enough to be classified as conditioned waters for use in irrigation
(20). The Potential
Salinity (PS) indicator shares the same ranges that ES (PS<3 meq/l are good
irrigation waters, PS between 3-15 meq/l conditioned waters and PS>15 meq/l
not recommended waters for use). All the waters analyzed in HR11 and HR13 were
classified with the PS indicator similarly to ES (table 1).
With average values
above 4.3 meq/l in winter and 11.1 meq/l in summer, the ES in HR12 waters were
slightly higher than those found in HR11 and HR13. This situation is comparable
to the PS indicator, with averages of 2.9 and 10.4 meq/l for both HR,
respectively. In general, there is a high proportion of good water for
irrigation in the region (ES and PS<3 meq/l) except for few isolated streams
and creeks with conditioned-type waters (ES and PS between 3-15 meq/l ) such as
De Las Casas (lower basin), Cañadón Fabré (middle basin), some sections of the
Pelque stream (upper basin) and the main course of the Coyle river (the most
important one of the HR12 in terms of annual flow). PS and ES values >15
meq/l were only registered in the Coy Inlet creek (lower HR12), which makes
water not recommended for irrigation.
Conclusions
Results from this study indicate that most water samples from
the three basins pose no significant salinity and sodicity hazards for
irrigating crops, vegetables, and pastures. Exceptions include a few temporary
streams and creeks. However, a significant proportion of water samples showed a
potential negative impact on soil structural stability, from the beginning of
the irrigation season (late winter to early spring) to the end of the growing
season (late summer). Both saline and sodium hazards of irrigation water may
re-transform the pre-existing soil solution through interactions with soil
physics and chemistry mainly by precipitation of salts. These potential hazards
must be considered during the planning and operating of irrigation schemes in
arid and semiarid regions. This is particularly important where overuse through
inefficient irrigation practices is common. The potential combined negative
effects of the use of these waters for irrigation, in relation to regional
soils, need further studies for the implementation of suitable irrigation
projects.
Acknowledgements
The authors acknowledge the financial support of the Government
of Santa Cruz province (Argentina) through the Secretaria de Estado de Ambiente
and the Instituto Nacional de Tecnología Agropecuaria (INTA). We appreciate the
generous contribution of a large number of agricultural and livestock producers
in the study region and public institutions during the extensive fieldwork. We
further thank the language editing service provided by LaIC (Laboratorio de
Inglés Científico), professional language service at UNPA (National University
of Austral Patagonia).
1. Almonacid, L.;
Pessacg, N.; Díaz, B. G.; Peri, P. L. 2023. Climate regionalization of Santa
Cruz province, Argentina. Revista Atmósfera (UNAM). 37: 245-258. DOI:
10.20937/ATM.53166
2. ANZECC
(Australian and New Zealand Environment and Conservation Council) & ARMCANZ
(Agriculture and Resource Management Council of Australia and New Zealand).
2000. National Water Quality Management Strategy. Paper N°4. Australian and New
Zealand guidelines for freshwater and marine water quality. Vol.1: 314p.
3. Ayers, R. S.; Westcot, D. W. 1985. Water quality for
agriculture. FAO Irrigation and Drainage. 29: 186 p.
4. Ayesa, J.; Bran,
D.; López, C.; Marcolín, A.; Barrios, D. 1999. Aplicación de la teledetección
para la caracterización y clasificación utilitaria de valles y mallines. Rev.
Arg. Producción Animal. 19: 133-138.
5. Carmona Crocco,
J.; Greco, S.; Tapia, R.; Martinelli, M. 2020. Use of indicators as a tool to
measure sustainability in agroecosystems of arid land, San Juan, Argentina.
Revista de la Facultad de Ciencias Agrarias. Universidad Nacional de Cuyo.
Mendoza. Argentina. 52(1): 190-209.
6. Diaz, B. G.;
Giménez, M.; Almonacid, L. R.; Gaspari, F.; Bertinat, M.; Peri, P. L. 2021.
Delineación y codificación de cuencas hidrográficas en la Patagonia Austral.
Boletín Geográfico. 43(2): 51-69.
7. Dirección
General de Aguas. 2020. Estadística hidrológica en línea. MOP. Chile.
https://dga.mop.gob. cl/servicioshidrometeorologicos/Paginas/default.aspx
(accessed 05 April 2022).
8. Eaton, F. M.
1950. Significance of carbonates in irrigation water. Soil Science. 69(2):
123-133.
9. FAO. 2015a.
Estudio del potencial de ampliación del riego en Argentina. Proyecto
UTF/ARG/017/ ARG Desarrollo Institucional para la Inversión. Buenos Aires.
Argentina. 136p.
10. FAO. 2015b.
Regional assessment of soil changes in Latin America and the Caribbean. In:
Status of the world’s soil resources. Food and Agriculture Organization of the
United Nations and Intergovernmental Technical Panel on Soils. Rome. Italy. 650
p.
11. Feitz, A. J.;
Lundie, S. 2002. Soil salinization: A local life cycle assessment impact
category. Int. J.LCA. 7(4): 244-249. DOI: 10.1065/Ica2002.06.084
12. Guida-Johnson,
B.; Abraham, E. M.; Cony, M. A. 2017. Salinización del suelo en tierras secas
irrigadas: perspectivas de restauración en Cuyo, Argentina. Revista de la
Facultad de Ciencias Agrarias. Universidad Nacional de Cuyo. Mendoza.
Argentina. 49(1): 205-215.
13. Jowett, I.
2020. Considerations of stream size in determining minimum flows and water
allocation limits in Taranaki rivers. Taranaki Regional Council. New Zealand.
37p.
14. Lesch, S. M.;
Suárez, D. L. 2009. A short note on calculating the adjusted SAR index.
American Society of Agricultural and Biological Engineers. 52(2): 493-496.
15. Malakar, A.;
Snow, D. D.; Ray, C. 2019. Irrigation water quality-A contemporary perspective.
Water. 11(7): 1-24. DOI: 10.3390/w11071482
16. Marín, M. L.
G.; Gómez, B. C.; Aragón, R. P. 2002. Análisis químico de suelos y aguas.
Manual de Laboratorio. Editorial Universitat Politècnica de València. Valencia.
España. 168 p.
17. Meybeck, M.
2003. Global occurrence of major elements in rivers. In: Treatise on
Geochemistry. 5: 207-223. DOI: 10.1016/B0-08-043751-6/05164-1
18. Mosley, M. P.;
Rowe, L. K. 1981. Low flow water chemistry in forested and pasture catchments,
Mawheraiti River. Westland. New Zealand J. of Marine and Freshwater Research.
15: 307-320. DOI: 10.1080/00288330.1981.9515926
19. Qadir, M.;
Sposito, G.; Smith, C. J.; Oster, J. D. 2021. Reassessing irrigation water
quality guidelines for sodicity hazard. Agricultural Water Management. 255.
DOI: 10.1016/j.agwat.2021.107054
20. Palacios, O.
V.; Aceves Navarro, E. 1970. Instructivo para el muestreo, registro de datos e
interpretación de la calidad del agua para riego agrícola. Escuela Nacional de
Agricultura (Ed.). Chapingo. México. 54 p.
21. Piper, A. M.
1944. A graphic procedure in the geochemical interpretation of water-analysis.
EOS Transactions American Geophysical Union. 25: 914-928. DOI:
10.1029/TR025i006p00914
22. Sarker, B. C.;
Michihiro, H.; Zaman, M. W. 2000. Suitability assessment of natural water in
relation to irrigation and soil properties. Soil Science and Plant Nutrition.
46(4): 773-786. DOI: 10.1080/00380768.2000.10409143
23. Svec, J. R.;
Kolka, R. K.; Stringer, J. W. 2005. Defining perennial, intermittent, and
ephemeral channels in Eastern Kentucky: Application to forestry best management
practices. Forest Ecology and Management. 214(1-3): 170-182. DOI:
10.1016/j.foreco.2005.04.008
24. Uitto, J. I.
2001. Global freshwater resources. In: World forests, markets, and policies.
Palo M.; Uusivuori, J.; Mery G. (Ed.), Kluwer Academic: 65-76. DOI:
10.1007/978-94-010-0664-4_3
25. USDA. 1954.
Diagnosis and improvement of saline and alkali in soils. Agriculture Handbook
N° 60. US Salinity Lab. L.A. Richards (Ed.). 172p.
26. USGS. 2006.
Collection of water samples (v2.0). In: National field manual for the
collection of water-quality data. Techniques of Water Resources Investigations.
Book 9. Virginia. USA. 231p.
27. Walczak, A.
2021. The use of world water resources in the irrigation of field cultivations.
J. of Ecological Engineering. 22(4): 186-206. DOI: 10.12911/22998993/134078
28. Weiner, R. E.
2013. Applications of environmental aquatic chemistry: A practical guide. CRC
Press. Taylor and Francis Group (Ed.). 3° Ed. 612p.
29. Wilcox, L. V.;
Blair, G. Y.; Bower, C. A. 1954. Effect of bicarbonate on suitability of water
for irrigation. Soil Sci. 77(4): 259-266.
30. Wilcox, L. V.
1955. Classification and use of irrigation waters. USDA N° 969. Washington.
USA. 21p. 29. Zaman, M.; Shaid, S. A.; Heng, L. 2018. Irrigation water quality.
In: Guideline for Salinity Assessment. Mitigation and Adaptation Using Nuclear
and Related Techniques. Springer (Ed.): 113-131. DOI:
10.1007/978-3-319-96190-3_5
31. Zaman, M.; Shaid, S.A.; Heng, L. 2018. Irrigation water
quality. In: Guideline for Salinity Assessment, Mitigation and Adaptation Using
Nuclear and Related Techniques. Springer (Ed.): 113- 131. DOI:
10.1007/978-3-319-96190-3_5.
Supplemmentary
material