Revista de la Facultad de Ciencias
Agrarias. Universidad Nacional de Cuyo. Tomo 57(1). ISSN (en línea) 1853-8665.
Año 2025.
Original article
Feeding
strategies for Holando Argentino steers aimed at different markets
Estrategias
de alimentación de novillos Holando Argentino para diferentes destinos
comerciales
Gabriel Alberto
Zurbriggen1, 2*,
María Belén Conde3,
Néstor Juan
Latimori3
1 Universidad Nacional de Rosario (UNR). Facultad de Ciencias
Agrarias. Parque Villarino. 2125 Zavalla. Santa Fe. Argentina.
2 UNR-Consejo Nacional de Investigaciones Científicas y Técnicas
(CONICET). Instituto de Investigaciones en Ciencias Agrarias de Rosario
(IICAR). Parque Villarino. 2125 Zavalla. Santa Fe. Argentina.
3 EEA-INTA Marcos Juárez. Ruta provincial 12 km 3. 2580 Marcos
Juárez. Córdoba. Argentina.
4 Universidad Nacional de Villa María. Instituto Académico
Pedagógico de Ciencias Básicas y Aplicadas. Av. Arturo Jauretche 1555. 5900
Villa María. Córdoba. Argentina.
5 INTA. Instituto Tecnología de Alimentos. Nicolás Repetto y De
Los Reseros s/n, 1686 Hurlingham, Buenos Aires, Argentina.
6 INTA-CONICET. Instituto de Ciencia y Tecnología de Sistemas
Alimentarios Sustentables. Nicolás Repetto y De Los Reseros s/n, 1686
Hurlingham, Buenos Aires, Argentina.
* zurbriggen.gabriel@gmail.com
Abstract
The objective was
to evaluate the performance and meat quality of Holando Argentino (HA) steers
under different feeding strategies. One hundred twenty-eight HA steers (181.4 ±
25.5 kg of live weight [LW]) were allocated to four treatments: FL: feedlot finishing
during 98 days; Gr1.25: grazing with 1.25% LW/day maize grain supplementation
during 235 days; Gr0.70: grazing with 0.70% LW/day maize grain supplementation
during 331 days; and GrFL: 287 days grazing background and 116 days feedlot
finishing. Average daily gains (ADG) were 1.14, 1.02, 0.82, and 0.81 kg/day for
FL, Gr1.25, Gr0.70, and GrFL, respectively (p<0.01). Adjusted productivity
ranged between 710 and 741 kg LW/ ha (p>0.05). GrFL and Gr0.70 presented the
highest carcass weight (CW; 288.3 ± 5.0 and 267.8 ± 12.2 kg, respectively,
p<0.001). Gr0.70 presented the lowest longissimus thoracis (LT) L*
(p<0.01) and the highest a* (p<0.05). Intramuscular fat was
the highest for GrFL (4.86 ± 0.93%, p<0.05). In all strategies, LT shear
force presented values of tender meat (29.9 ± 3.4 N, p=0.60). HA steers have
the flexibility to produce tender meat under different, high-productivity
strategies.
Keywords: dairy breeds,
grazing steers, supplementation, feedlot steers, shear force, intramuscular
fat, meat color, fat color
Resumen
El objetivo fue
evaluar el desempeño y la calidad de la carne de novillos Holando Argentino
(HA) alimentados bajo diferentes estrategias. Se utilizaron 128 terneros HA
(181,4 ± 25,5 kg de peso vivo [PV]) que se asignaron a cuatro tratamientos: FL:
terminación a corral durante 98 días; Gr1,25:
invernada pastoril con suplementación con grano de maíz al 1,25% PV/ día
durante 235 días; Gr0,70: invernada pastoril con suplementación con grano de
maíz al 0,70% PV/día durante 331 días; y GrFL: recría pastoril durante 287 días
y terminación a corral durante 116 días. Los aumentos medios diarios fueron
1,14, 1,02, 0,82 y 0,81 kg PV/ día para FL, Gr1,25,
Gr0,70 y GrFL, respectivamente (p<0,01). La productividad ajustada varió
entre 710 y 741 kg PV/ha (p>0,05). GrFL y Gr0,70
presentaron el mayor peso de res (288,3 ± 5,0 y 267,8 ± 12,2 kg,
respectivamente, p<0,001). Gr0.70 presentó el menor L* (p<0,01) y
el mayor a* (p<0,05) del longissimus thoracis (LT). El mayor
contenido de grasa del LT fue producido por GrFL (4,86 ± 0,93%, p<0,05). En
todas las estrategias, la resistencia al corte del LT presentó valores que
corresponden a carnes tiernas (29,9 ± 3,4 N, p=0,60). Los novillos HA tienen la
flexibilidad de producir carne tierna bajo diferentes estrategias de alta
productividad.
Palabras clave: razas lecheras,
novillos en pastoreo, suplementación en pastoreo, alimentación a corral,
resistencia al corte, grasa intramuscular, color de la carne, color de la grasa
Originales: Recepción: 18/06/2024 - Aceptación: 10/03/2025
Introduction
The availability of
Holando Argentino (HA) male steers in the Argentine pampas represents an
opportunity for meat production, considering their high growth potential and
favorable purchase-to-sale price ratio. Locally, different feeding strategies
have been evaluated for HA steers. On one side, intensive grazing systems
slaughter between 460 and 540 kg LW, aiming for export markets (19,
21). On the other hand, calf feeding systems with slaughter LW
between 300 and 370 kg (20) satisfy local
demands characterized by small cuts.
Dairy breeds
present higher maintenance requirements and different fat deposition patterns
than beef breeds, compromising early slaughter and market acceptability (3). One way to
increase local acceptability and market allocation flexibility of meat from HA
steers, fed under grazing systems, is to achieve high growth rates, reaching
the finishing endpoint at moderate LW (i.e. <450 kg). In this sense,
using energetic supplements can increase daily gain and fattening rate,
reducing the growing and finishing periods (24,
37). Furthermore, new export market opportunities like tax-free
meat quota for the European Union, called quota 481, could emerge (23). This quota
applies to meat from steers fed with high-concentrate diets for a minimum of
100 days and less than 30 months of age at slaughter.
Concerning meat
quality, previous research has shown that meat obtained from dairy breeds has
similar overall quality to that obtained from British beef breeds (3). Accordingly, Latimori
et al. (2008) found that HA steers fed under different strategies presented
no differences in tenderness compared with British or crossbred steers, despite
having lower marbling scores than meat from Angus steers.
Feeding strategies for finishing steers can vary from pasture-based
to concentrated feeding, resulting in different LW gains, age at harvest, final
LW, CW, and fatness degree, which can also impact meat quality and market
destination (30).
Therefore, strategies need to be evaluated taking all these aspects into
account. The main objective of this study was to evaluate productivity, animal
performance, and meat quality from HA steers fed under contrasting strategies,
ranging from grazing with different supplementation levels to feedlot
finishing. A second objective was to identify the main traits defining carcass
and meat quality of HA steers across diverse feeding strategies and to quantify
the relationships among these traits.
Materials
and methods
Site
and feeding strategies
The study was
conducted at the Marcos Juárez Agricultural Experimental Station of the
National Institute of Agricultural Technology (INTA). Grazing strategies were
evaluated on mixed pastures of alfalfa (Medicago sativa) and tall fescue
(Lolium arundinaceum), established on argiudoll soil with no
limitations. The region’s climate is temperate, with a mean temperature of
17.9°C and an annual rainfall of 887 mm (14). Live animal
management was conducted according to the standards and conditions of the
Animal Ethics Committee of INTA.
A total of 128 HA
steers with 5 to 7 months of age (181.4 ± 25.5 kg LW) were purchased. Upon
arrival at the Experimental Station, animals were treated against internal
parasites and vaccinated against Clostridia and respiratory diseases. The
animals were then allocated to four feeding strategies. Group FL: ad libitum
feedlot system for 98 days, targeting the local market (30 steers, 202.9 ±
13.8 kg LW, 10 steers x 3 repetitions); group Gr1.25: grazing with 1.25 %LW/day
dry cracked maize supplementation (DM basis) for 235 days, targeting both local
and export markets (36 steers, 172.9 ± 19.6 kg LW, 9 steers x 4 repetitions);
group Gr0.70: grazing with 0.70% LW/day dry cracked maize supplementation (DM
basis) for 331 days, targeting export markets (32 steers, 195.0 ± 11.7 kg LW, 8
steers x 4 repetitions); and group GrFL: grazing background without
supplementation for 287 days followed by ad libitum feedlot finishing
for 116 days, targeting the export quota 481 (30 steers, 156.7 ± 23.8 kg LW, 10
steers x 3 repetitions).
Grazing
management and supplementation
Pasture management and supplementation of the grazing strategies
are summarized in table 1.
Table 1.
Grazing management and supplementation.
Tabla 1. Manejo
del pastoreo y suplementación.
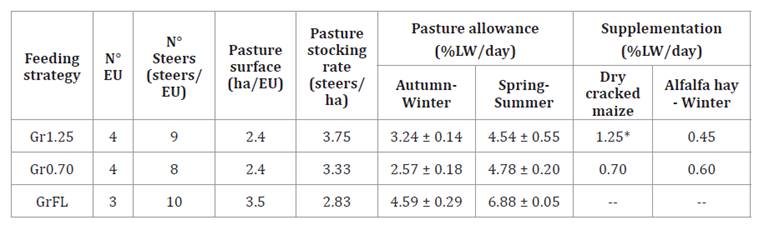
Gr1.25: grazing finishing with
high supplementation; Gr0.70: grazing finishing with low supplementation; GrFL:
grazing background and feedlot finishing; EU: experimental unit; LW: live weight.
Pasture allowance and supplements are expressed on a DM basis.* supplementation
was delivered in two daily feedings.
Gr1.25: invernada pastoril con alta suplementación;
Gr0.70: invernada pastoril con baja suplementación; GrFL: recría pastoril y terminación
a corral. EU: unidad experimental; LW: peso vivo. La asignación de pastura y la
suplementación están expresadas en materia seca. * suplementación
dividida en dos entregas diarias.
Each experimental unit had pasture divided into 6 paddocks
grazed rotationally, with independent water troughs (minimum of 16 cm/animal)
and group feed bunks providing 0.67 m/animal. Steers grazed rotationally, with
paddock occupation and resting periods ranging from 4 to 9 days and from 21 to
60 days, respectively, depending on pasture production. Gr1.25 and Gr0.70
included permanent supplementation with dry cracked maize grain and winter
supplementation with alfalfa hay.
Pre-grazing pasture biomass was estimated every two weeks (8 to
18 days depending on the season) by 10 sites of 0.25 m2 cut at 3 cm height. A
subsample (200-400 g) was dried at 60°C for 48 h to determine DM content and
milled to 1 mm for subsequent analysis (table 2).
Table 2.
Pasture chemical composition.
Tabla 2. Composición
química de las pasturas.
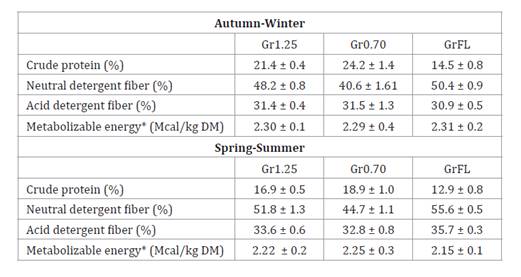
Gr1.25: grazing finishing with
high supplementation; Gr0.70: grazing finishing with low supplementation; GrFL:
grazing background and feedlot finishing. * Calculated using the equation from McLeod
and Minson (1976):
Metabolizable energy (Mcal/kg DM) = 3.6 x (92.3 - 0.91 x %ADF) / 100.
Gr1.25: invernada pastoril con alta suplementación;
Gr0.70: invernada pastoril con baja suplementación; GrFL: recría pastoril y
terminación a corral. * Calculado usando la ecuación de McLeod
y Minson (1976):
Energía metabolizable (Mcal/kg MS) = 3,6 x (92,3 - 0,91 x %FDA) / 100.
Crude protein (CP) was determined according to Horneck
and Miller (1988), while neutral detergent fiber (NDF) and acid detergent fiber
(ADF) were determined according to Van Soest et
al. (1991). Pasture metabolizable energy was estimated using the
digestibility equation McLeod and Minson (1976).
Feedlot
management
The FL and GrFL
strategies used six outdoor pens of 250 m2 for feedlot finishing.
Animals assigned to the FL strategy had a 45-day pre-experimental period with ad
libitum access to alfalfa hay, increasing mean LW from 177.6 to 202.9 kg
before entering the feedlot finishing period. The analysis did not include this
period. FL strategy used 30 HA steers allocated randomly in three pens for a
finishing period of 98 days. Whereas for the finishing phase of the GrFL
strategy, 30 HA steers were allocated in three pens for 116 days after the
mentioned grazing background phase.
In both strategies, the proportion of grain in the diet was
gradually increased during an adaptation period of 21 days. The final diet
consisted of a typical finishing diet based on dry cracked maize grain, alfalfa
hay, soybean meal, and a mineral supplement (table 3).
Table 3.
Ingredients and chemical composition of feedlot diet.
Tabla 3. Ingredientes y composición química de las dietas de corral.
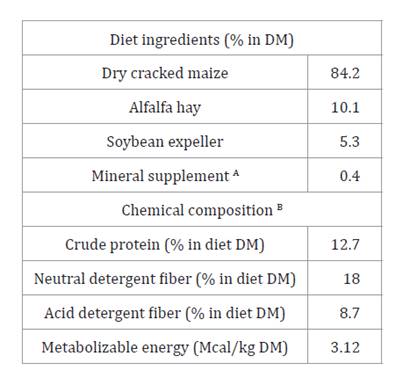
A supplement composition: Ca, 295
g/kg; mg/kg: Fe 15000, Mn 14889, Zn 13000, Cu 1600, Se 9, I 140, Co 250,
monensin 8330; UI/kg: vit. A 3000000, vit. D 1200000, vit. E 100; B calculated
from composition and energy concentration of individual ingredients (31).
A composición del suplemento: Ca, 295 g/ kg; mg/kg: Fe
15000, Mn 14889, Zn 13000, Cu 1600, Se 9, I 140, Co 250, monensina 8330; UI/kg:
vit. A 3000000, vit. D 1200000, vit. E 100; B calculado a partir de la composición y
concentración energética de los ingredientes individuales (31).
It was delivered once daily between 8:00 and 9:00, adjusting the
amount offered to attain 10% of feed refusal and ensure ad libitum access
to feed. Each ingredient was sampled monthly, dried at 60°C for 48 h to
determine DM content, and milled to 1 mm for the same analysis described for
pasture quality. Mean diet metabolizable energy was estimated from
metabolizable energy of each component reported by NRC (1996)
and their respective proportion in the diet.
Animal
performance and feeding strategy productivity
Animals were
individually weighed without fasting between 8:00 and 9:00, at the beginning,
every 4-5 weeks, and at the end of each feeding period. LW was adjusted
considering 5% of shrinkage. For feedlot systems (FL and GrFL), mean DM intake
(DMI) was estimated per pen of 10 steers (experimental unit) as the difference
between offered and refused feed over 5 days, calculated monthly. DMI was used
to estimate feed conversion as the ratio of mean DMI to average LW gain.
Productivity,
measured as LW production per pasture surface and adjusted surface, was
estimated for the Gr1.25, Gr0.70, and GrFL feeding strategies. Surface
adjustment considered maize grain equivalents used for Gr1.25 and Gr0.70
supplementation and GrFL pen feeding (16). The maize crop
surface needed was calculated considering a mean yield of 12,000 kg/ha for the
southeast of Córdoba, Argentina (15).
Carcass
characteristics and meat quality
The timing of
slaughter for each strategy was based on a visual evaluation of the necessary
fatness degree for the aimed market, verified by local cattle buyers for both
local and export markets. For GrFL, slaughter timing also required a minimum of
100 days on a high-concentrate diet to target the export quota 481. Three
steers per experimental unit from Gr1.25 and Gr0.70, and four steers per
experimental unit from FL and GrFL, were randomly selected for carcass and meat
determinations, resulting in 12 carcasses per feeding strategy. The slaughter
of steers from all feeding strategies was carried out at a commercial abattoir.
At 48 h postmortem, CW was recorded, and a section containing the 10th, 11th, and 12th
ribs was removed from the left side of each carcass. Samples were
kept at 4°C until 72 h postmortem. Then, ribs were deboned and separated
into 2.5 cm thick steaks, vacuum-packed, and stored at -20°C until further
analysis. When necessary, samples were thawed at 4°C for 24 h.
Fat thickness (FT)
and ribeye area (REA) were measured at the 12th rib using a gauge and
digital planimeter, respectively. Intramuscular fat (IMF) content was
determined in duplicate by the Soxhlet method (SOXTEC SYSTEM HT 1043 Extraction
Unit) using an aliquot of 5 g per steak (10). The results are
expressed as a percentage of fresh muscle tissue.
To determine the
thawing loss, each steak was placed on a plastic mesh inside a sealed plastic
container, preventing the sample from coming into contact with the released
liquid, for 24 h at 4°C. The results were calculated as the difference between
initial and final weights referring to initial weight and expressed as
percentage (28).
Muscle and
subcutaneous fat CIE colors parameters were obtained sixfold with a Minolta
CR-400 (Konica Minolta, Japan). The colorimeter used illuminant D-65, 8 mm port
size, 2° observer, and was calibrated on black and white plates. Measurements
followed AMSA
(2012)
guidelines with 45 min of blooming. Also, pH was recorded on each steak
(ThermoOrion 420Aplus; USA).
Water holding
capacity (WHC) was determined following the filter paper press methodology
described by Coria
et al. (2020). The WHC was expressed as the percentage of free juice expelled
(WHC = meat area / total liquid infiltrated area x 100). Cooking loss was
determined by measuring the weight loss of samples after dry heat cooking (oven
temperature: 170°C; sample thermal center temperature: 71°C) followed by 20 min
of cooling at room temperature (5). The result was
reported as a percentage of weight loss relative to the initial sample weight.
Warner Bratzler shear force (WBSF) was assessed as described by Coria et
al. (2020). Steak were cooked on a preheated electric grill (George
Foreman, USA) to an internal temperature of 71°C. Eight cores (1.25 cm in
diameter, 2.5 cm in height) per steak were removed parallel to the fibers, and
WBSF was assessed with a TA-XT Plus® (Surrey, UK). The results were expressed
in Newtons (N).
Data
analysis
Linear models were
adjusted considering feeding strategy as a fixed effect for productive,
carcass, and meat quality traits. ANOVA was used to evaluate differences, and
means were compared using the LSD test. For WBSF analysis, IMF content was
initially included as a covariate. However, since no significant effect was
found for the covariate (p>0.05), it was excluded from the model. Average
daily gains were calculated through linear regression models of LW as a
function of days for each feeding strategy. Productivity per pasture surface
and adjusted surface was estimated. Then, a linear model with the linear and
quadratic components of the stocking rate was fitted to assess productivity as
a function of stocking rate.
On the other hand,
relationships between productive, carcass, and meat traits were evaluated using
stepwise linear regression, including FT, REA, muscle lightness (L*) and
redness (a*), IMF, and WBSF. The initial regressor variables were: CW,
days on feed, total grain intake (TGI), and average daily gain (ADG) for FT and
REA; CW, FT, ADG, and pH for muscle L* and a*; CW, days on feed,
TGI, FT, and ADG for IMF content; and CW, pH, FT, IMF, WHC, and thawing losses
for WBSF.
The models and
analyses were carried out with the Infostat statistical program (6). All models used
each group of steers as the experimental unit.
Results
Animal
performance and feeding strategy productivity
The evolution of steers’ LW under the different feeding
strategies is shown in figure 1.
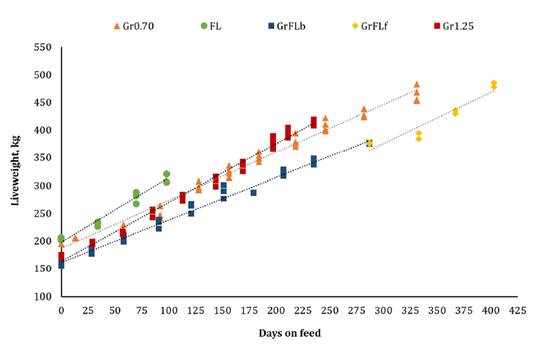
FL: terminación
a corral (y = 198,02 + 1,16 x, R2 = 0,97, p<0,001); Gr1,25: invernada
pastoril con suplementación al 1,25 %PV/día con grano de maíz partido seco (y =
163,37 + 1,06 x, R2 = 0,99,
p<0,001); Gr0,70: invernada pastoril con suplementación al 0,70 %PV/día con
grano de maíz partido seco (y = 186,42 + 0,87 x, R2 = 0,98, p<0,001); GrFL: recría pastoril
(GrFLb, y = 161,26 + 0,76 x, R2 = 0.99, p<0,001) y terminación a corral
(GrFLf, y = 96.03 + 0,93 x, R2 = 0,89, p<0,001). Los valores corresponden
a las medias de cada unidad experimental.
Figure
1. Live weight evolution of Holando Argentino steers
under different feeding strategies.
Figura 1. Evolución
del peso vivo de novillos Holando Argentino bajo diferentes estrategias de alimentación.
Mean LW gains and final LW were different between treatments (table
4).
Table 4. Animal
performance and productivity.
Tabla 4. Desempeño
animal y productividad.
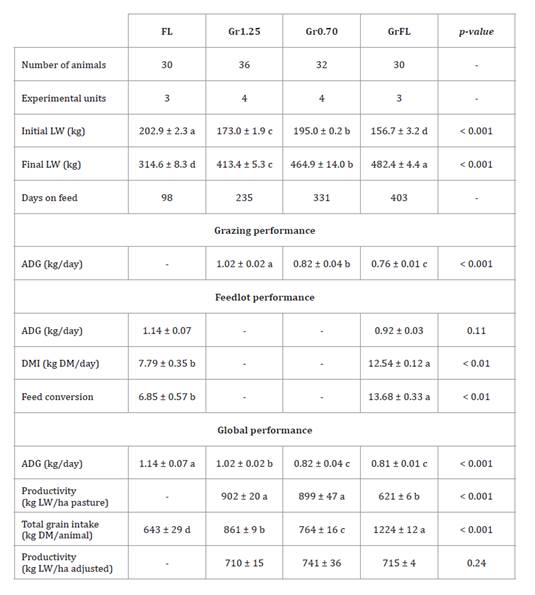
Different letters indicate
significant differences (p<0.05). FL: feedlot system; Gr1.25: grazing
finishing with high supplementation; Gr0.70: grazing finishing with low
supplementation; GrFL: grazing background and feedlot finishing; ADG: average
daily gain, DMI: dry matter intake, LW: live weight.
Letras diferentes indican diferencias
estadísticamente significativas (p<0,05). FL: terminación a corral; Gr1.25:
invernada pastoril con alta suplementación; Gr0.70: invernada pastoril con baja
suplementación; GrFL: recría pastoril y terminación a corral; ADG: aumento
medio diario de peso vivo, DMI: consumo de materia seca, LW: peso vivo.
FL strategy presented the highest LW gains, followed by Gr1.25,
whereas the lowest gains were obtained with Gr0.70 and GrFL strategies. The
final LW presented an inversed trend compared with LW gain, with 482.4, 464.9,
413.4, and 314.6 kg LW for GrFL, Gr0.70, Gr1.25, and FL, respectively.
Grazing LW gain was
highest for Gr1.25, followed by Gr0.70, while the grazing background phase of
GrFL showed the lowest LW gains. Whereas feedlot finishing LW gain was not
different between FL and GrFL (p=0.11). However, DMI was higher in GrFL than in
FL (12.54 vs. 7.79 kg DM, p<0.01), as well as feed conversion (13.68 vs.
6.85, p<0.01).
Productivity per pasture surface was higher for supplemented grazing
strategies (Gr1.25 and Gr0.70) than the background phase from GrFL. When
productivity estimations included feedlot finishing of GrFL (both production
and surface needed for feedlot diet ingredients) and the surface needed for
Gr1.25 and Gr0.70 supplements supply, no significant differences were obtained
(p=0.239). In all cases, adjusted productivity ranged between 710 and 741 kg
LW/ha, presenting no response to the increase in stocking rates (figure
2).
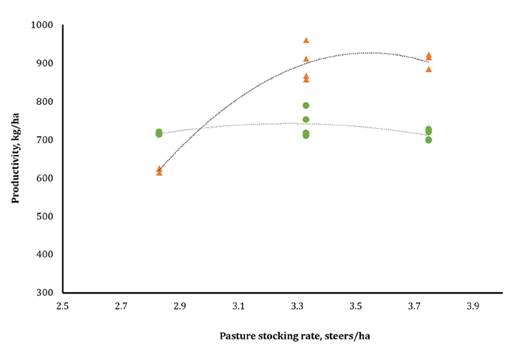
Productividad
por superficie de pasturas (kg/ha, triángulos naranjas, y = -6570.60 + 4228.39
x - 596.22 x2,
R2 = 0.96, L:
p<0.001; Q: p<0.001) y productividad por superficie ajustada
(kg/ha, círculos verdes, y = -713.63 + 889,89 x - 136,04 x2, R2 = 0,32, L: p=0,097; Q: p=0,094)
en función de la carga animal. El ajuste de superficie se realizó considerando
equivalentes de grano de maíz utilizados para suplementación en Gr1.25 y
Gr0.70, y para la terminación a corral en GrFL. La superficie de cultivo de
maíz necesaria para abastecer los equivalentes de grano utilizados se calculó
considerando un rendimiento medio de 12.000 kg/ha. L: significancia de
la componente lineal del modelo; Q: significancia del componente
cuadrático del modelo. Los valores presentados corresponden a las medias de
cada unidad experimental.
Figure
2.
Productivity per pasture surface and adjusted productivity as a function of
stocking rate.
Figura 2. Productividad
por superficie de pasturas y por superficie ajustada en función de la carga
animal.
Carcass
and meat quality
Carcass
characteristics and meat quality are shown in table 5.
Table 5. Carcass
characteristics and meat quality.
Tabla
5. Características de res y calidad de carne.
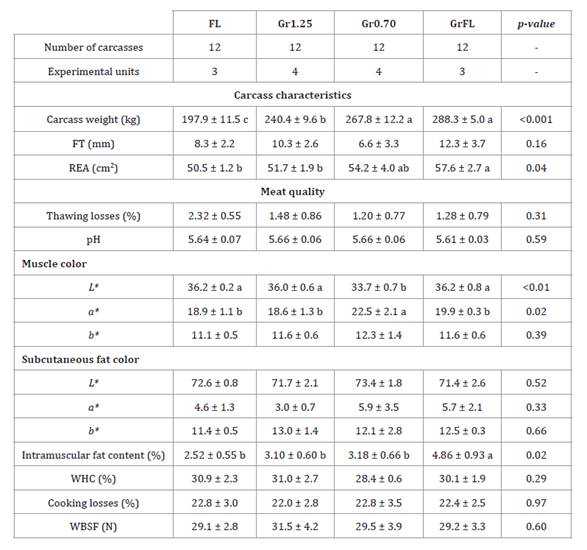
Different letters indicate
significant differences (p<0.05). FL: feedlot system; Gr1.25: grazing
finishing with high supplementation; Gr0.70: grazing finishing with low
supplementation; GrFL: grazing background and feedlot finishing, FT: 12th rib fat
thickness, REA: ribeye area, L*: lightness, from black (0) to white (100),
a*: redness, from green (negative values) to red (positive values), b*:
yellowness, from blue (negative values) to yellow (positive values), WBSF:
Warner Bratzler shear force, WHC: water holding capacity.
Letras diferentes indican
diferencias estadísticamente significativas (p<0,05). FL: terminación a
corral; Gr1.25: invernada pastoril con alta suplementación; Gr0.70: invernada
pastoril con baja suplementación; GrFL: recría pastoril y terminación a corral;
FT: espesor de grasa dorsal en la 12° costilla, REA: área de ojo de bife, L*:
luminosidad, desde negro (0) a blanco (100), a*: desde verde (valores
negativos) a rojo (valores positivos), b*: desde azul (valores
negativos) a amarillo (valores positivos), WBSF: resistencia al corte de Warner
Bratzler, WHC: capacidad de retención de agua.
GrFL and Gr0.70
feeding strategies presented the highest CW, followed by Gr1.25, while FL
presented the lowest (p<0.001). FT did not differ between feeding strategies
(p>0.05), whereas GrFL REA was larger than that of Gr1.25 and FL
(p<0.05).
Regarding color
parameters, meat from Gr0.70 was the only one to show differences, with lower L*
(p<0.01) and higher a* than Gr1.25, GrFL, and FL (p<0.05). No
differences were observed for the subcutaneous fat color parameters (p>0.05).
Meat hardness,
estimated by longissimus thoracis WBSF, presented no differences between
feeding strategies, nor for WHC nor losses due to thawing or cooking
(p>0.05). IMF content of the longissimus thoracis was higher for GrFL
than Gr1.25, Gr0.70, and FL (p<0.05).
Relationship
between productive, carcass, and meat traits
FT was explained by
TGI and ADG (table
6),
whereas REA was explained by CW and days on feed. On the other hand, IMF
content of the longissimus thoracis was explained by TGI as the only
trait retained by the model (R2 = 0.63).
Table 6. Relationship
between productive, carcass, and meat traits.
Tabla
6. Relación entre parámetros
productivos, de res y de calidad de carne.
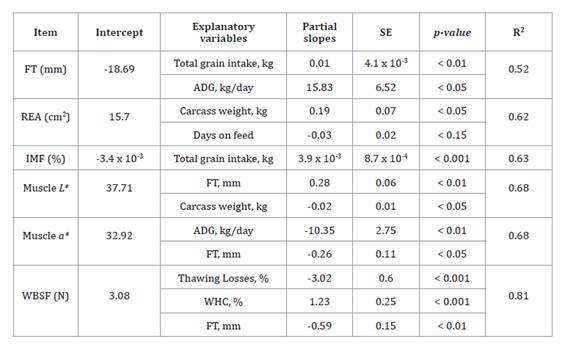
FT: 12th rib fat thickness, REA: ribeye area, L*:
lightness, from black (0) to white (100), a*: redness, from green
(negative values) to red (positive values), WHC: water holding capacity of the longissimus
thoracis, IMF: intramuscular fat content of the longissimus thoracis,
ADG: average daily gain, WBSF: Warner Bratzler shear force.
FT: espesor de grasa dorsal en la
12° costilla, REA: área de ojo de bife, L*: luminosidad, desde negro (0)
a blanco (100), a*: desde verde (valores negativos) a rojo (valores
positivos), WHC: capacidad de retención de agua del longissimus thoracis,
IMF: contenido de grasa intramuscular del longissimus thoracis, ADG:
aumento medio diario de peso vivo, WBSF: resistencia al corte de Warner
Bratzler.
In relation to muscle color, L* was explained by FT and
CW (R2 = 0.68), while a*
was explained by ADG and FT (R2 = 0.68). WBSF was
explained by thawing losses, WHC, and FT as variables kept by the model (R2
= 0.81).
Discussion
Animal
performance and feeding strategy productivity
Feeding strategies
with higher energy supplementation levels resulted in greater LW gains during
grazing. This was expected as pasture allocations were within the range of
response to supplementation suggested by Beretta et al. (2006).
Comparing grazing
strategies (Gr1.25 and Gr0.70), the higher LW gains of Gr1.25 led to faster
fattening rates and earlier slaughters at lower LW than Gr0.70. Similarly, Manni et
al. (2013) reported that increasing concentrate supplementation in 1 kg
DM/day improved growth rates by 0.073 kg LW/day and 0.048 kg CW/day in growing
dairy bulls. The authors also reported an increase in CW and a slight increase
in carcass fatness, suggesting that concentrate supplementation improves growth
and carcass fat deposition (25).
In the feedlot
finishing phases, the higher DMI and the lower feed efficiency in GrFL compared
with FL align with Lancaster
et al. (2014), who compared calf-fed versus yearling systems. They suggested
that lower feed efficiency of steers entering the feedlot older and heavier
could result from higher maintenance requirements and higher fat composition in
LW gain. This effect could be steeper in dairy breeds due to larger and more
metabolically active organs than beef breeds (3). Moreover, GrFL
steers were fed beyond the 8.0 mm subcutaneous FT endpoint (12.3 mm), which
must have contributed to the decay in feed efficiency as reported by Zurbriggen
et al. (2022).
In contrast to Lancaster
et al. (2014), this study found no higher LW gains in backgrounded (GrFL)
steers compared to FL steers. This may explain the lack of adjusted
productivity advantages for GrFL relative to Gr0.70 and Gr1.25, since the
increase in productivity through feedlot finishing relies on the high LW gains
expected during this period.
Supplemented
grazing strategies (Gr1.25 and Gr0.70) showed higher pasture productivity than
not supplemented GrFL background phase, due to higher LW gains and stocking
rates. However, pasture productivity was similar between Gr1.25 and Gr0.70,
since the higher LW gain and stocking rate of Gr1.25 was offset by the shorter
feeding period and the lower LW at slaughter.
When productivity
was estimated, including the feedlot finishing period from the GrFL strategy
and the adjustments for grain equivalents, no differences were found between
GrFL, Gr1.25, and Gr0.70. All strategies achieved adjusted productivities
between 700 and 750 kg LW/ha, corresponding with high productivity levels for
intensified grazing systems. However, GrFL productivity was below the 1000 kg
LW/ha previously reported for grazing background and feedlot finishing systems
from the Argentine pampas (17, 22), which may
compromise the strategy’s viability.
Carcass
characteristics and meat quality
Morales
Gómez et al. (2022) compared feedlot and pasture systems with different LW gain
targets (1.50 and 0.90 kg/day for feedlot and 0.90 and 0.60 kg/day for pasture)
and found the highest FT in the steers from the feedlot system targeting high
LW gains (1.50 kg/day). Furthermore, Morales Gómez et al. (2022) reported that
pasture systems and feedlots targeting low LW gains (0.90 kg/day) presented FT
at slaughter lower than 6 mm, which may have threatened meat quality (33). While grazing
systems reported by these authors achieved LW gains above 0.60 kg/day, large
variations in gain during the feeding period may have reduced fattening rate
and resulted in leaner carcasses.
In the present
study, the grazing strategies achieved higher mean LW gains (0.82 and 1.02
kg/day for Gr0.70 and Gr1.25, respectively) with low variations in LW gain
through the feeding period (figure
1).
These results explain the proper FT reached at slaughter. Consistent LW gains,
supported by strategic supplementation and well-managed forage allowances, are
key to achieving proper productivity and meat quality in grazing finishing
systems. In this sense, even though FT did not differ between the feeding
strategies, FT variations were explained by TGI and LW gain.
The increase in REA with higher CW was also found in previous
research with beef steers (4, 8, 43).
Gr0.70 and GrFL strategies achieved the highest REA due to the longer feeding
periods together with moderate LW gains, which allowed the higher CW and muscle
growth.
In this study, TGI
mainly explained the IMF content of the longissimus thoracis, consistent
with previous research showing increased marbling with the inclusion of
high-starch diets. Testa
(2017)
found that marbling score was increased by including high-starch diets during
the finishing of beef steers. Garcia et al. (2008) also indicated
that diet was a determinant for IMF deposition in beef and dairy steers, with
no differences between breeds. In addition, Manni et al. (2018) found that
increasing energy intake and carcass fatness increased the IMF content of the longissimus
lumborum in dairy bulls.
Despite using the
same finishing diet, the difference in IMF between FL and GrFL was expected. Pethick
et al. (2004) suggested that IMF deposits linearly between a CW of 200 and
400 kg. In the FL strategy, its short duration with no previous background led
to lighter carcasses with a mean CW below 200 kg. In contrast, the
pasture-based background of the GrFL strategy allowed a higher CW at feedlot
entry. This could have allowed coupling the finishing period with high starch
diets with the phase of linear increase in IMF proposed by Pethick
et al. (2004).
In this sense, Lancaster
et al. (2014) suggested that achieving moderate gains during long stocker
phases could improve marbling at constant FT by reaching heavier placement
weights at feedlot finishing. However, this could only apply to strategies
including feedlot finishing. Whereas for grazing strategies, LW gains need to
be high enough to ensure sufficient fat accretion and efficient feeding
duration.
Meat color is one
of the most important meat attributes since it defines consumers’ purchase
decisions (39). Subcutaneous FT
influences carcass chilling rate and pH drop, and ultimately adequate meat pH,
as major factors defining meat color (13). Page et
al. (2001) proposed a 7.6 mm FT threshold to attain bright meat, which
aligns with this study’s results. The lower L* obtained with the Gr0.70
strategy could be attributed to 6.6 mm FT reached, which was below this
threshold.
Grass-finished
Holando Argentino beef could have acceptable color if steers had enough fatness
at slaughter. In this study, the increase in dry cracked maize supplementation
from 0.70 to 1.25% LW/day resulted in higher L* and lower a*. The
use of different feeding strategies can allow for targeting different fat
endpoints and attaining the meat characteristics that consumers demand.
Despite all feeding
strategies being contrasted in diet, weight, and age, muscle color parameters
were within the light and medium meat color range (13). Meat a*
was above the 14.5 threshold for acceptability (11). In all cases,
meat pH was within the normal range, suggesting that glycogen levels were
enough in all strategies (13, 33).
Although the
contrasting differences in feeding strategies, there were no differences in fat
color. Fat yellowness (b* value) is a major trait defining purchase
decisions since it is undesirable for most consumers from markets of different
countries (9). Fat b* was
between 11.4 and 13.0, lower than the 19.2 mean reported for grazing steers (27) and similar to the
14.1 mean reported for feedlot steers in Argentina (42).
Usually, pasture
feeding increases b* due to the higher carotene content in fresh
pastures compared to concentrates. The lack of differences between strategies
in this study may be due to the high LW gains of the grazing strategies. In
this sense, maintaining high LW gains may have diluted carotenoids with
subcutaneous fat accretion (9).
Shear force was
explained by thawing losses, water holding capacity, and FT. However, the low
change rate in shear force per mm FT was explained by all strategies achieving
at least 6.6 mm of mean FT. This fat coverage was above the threshold proposed
by Savell
et al. (2005) and slightly below the 7.6 mm FT threshold proposed by Dolezal
et al. (1982) to obtain tender meat.
Morales
Gómez et al. (2022) found differences in meat WBSF between grazing and feedlot-finished
steers. These differences were attributable to different muscle pH for feedlot
and grazing animals (5.62 and 5.97, respectively) since final muscle pH of
grass-fed animals could be associated with dark, firm, and dry meat. This
evidences the low FT reached by this feeding system and differs from the FT
obtained in the present study for grazing steers, which attained 6.6 mm of mean
FT.
Previous research has proposed different WBSF threshold values
for consumer unacceptability. Platter et
al. (2003) suggested 43.12 N, while Miller et al.
(2001) suggested 55.9 N. In the present study, meat from all
strategies could be considered tender since WBSF values were below these
thresholds.
The higher IMF
content reached under the GrFL strategy did not affect longissimus thoracis shear
force. According to previous research, IMF content explains only 17% of sensory
panel tenderness variation (32). Moreover, Zurbriggen
et al. (2022) reported that once 8.0 mm FT was reached, the increase in IMF
from 2.7 to 7.3% only tended to reduce WBSF in British feedlot steers. However,
the increase in marbling must not be belittled since it could improve juiciness
and flavor (40) and may be needed
to access some export markets.
Conclusion
Grazing finishing
strategies for HA steers must achieve and maintain high LW gains to attain the
fatness required to guarantee meat tenderness and reduce fat yellowness.
Energetic supplementation can be used to achieve this but also to manipulate
slaughter LW and IMF to meet different market demands.
Incorporating a
grazing rearing phase before feedlot entry to increase the placement weight can
increase IMF content, which is relevant for certain export markets. This
strategy, however, presented the highest TGI and low feed efficiency, making
its viability dependent on pricing conditions in the export market.
Overall, HA steers have the flexibility to produce high-quality
meat under different feeding strategies. Production systems can strategically
use maize grains as a supplement or in feedlot diets, managing stocking rates,
LW gains, and finishing endpoints to achieve high productivity and also
manipulating marbling and FT to obtain meat quality that different markets
demand.
1. AMSA. 2012. Meat
color measurement guidelines. Champaign, Illinois USA. American Meat Science
Association.
2. Beretta, V.;
Simeone, A.; Elizalde, J. C.; Baldi, F. 2006. Performance of growing cattle
grazing moderate quality legume-grass temperate pastures when offered varying
forage allowance with or without grain supplementation. Australian Journal of
Experimental Agriculture. 46(7): 793-797. https://doi.org/10.1071/EA05331
3. Bown, M. D.;
Muir, P. D.; Thomson, B. C. 2016. Dairy and beef breed effects on beef yield
beef quality and profitability: a review. New Zealand Journal of Agricultural
Research. 59(2): 174-184. https://doi.org/10.1080/00288233.2016.1144621
4. Bruns, K. W.;
Pritchard, R. H.; Boggs, D. L. 2004. The relationships among body weight, body
composition, and intramuscular fat content in steers. Journal of Animal
Science. 82: 1315-1322. https://doi.org/10.2527/2004.8251315x
5. Coria, M. S.;
Reineri, P. S.; Pighin, D.; Barrionuevo, M. G.; Carranza, P. G.; Grigioni, G.;
Palma, G. A. 2020. Feeding strategies alter gene expression of the calpain
system and meat quality in the longissimus muscle of Braford steers.
Asian-Australasian Journal of Animal Sciences. 33(5): 753-762.
https://doi.org/10.5713/ajas.19.0163
6. Di Rienzo, J.
A.; Casanoves, F.; Balzarini, M. G.; Gonzalez, L.; Tablada, M.; Robledo, C. W.
2020. InfoStat versión 2020. Centro de Transferencia InfoStat, FCA. Universidad
Nacional de Córdoba. Argentina. http://www.infostat.com.ar
7. Dolezal, H. G.;
Smith, G. C.; Savell, J. W.; Carpenter, Z. L. 1982. Comparison of subcutaneous
fat thickness, marbling and quality grade for predicting palatability of beef.
Journal of Food Science. 47: 397-401. https://doi.org/10.1111/j.1365-2621.1982.tb10089.x
8. Duckett, S. K.;
Wagner, D. G.; Yates, L. D.; Dolezal, H. G.; May, S. G. 1993. Effect of time on
feed on beef nutrient composition. Journal of Animal Science. 71: 2079-2088.
https://doi. org/10.2527/1993.7182079x
9. Dunne, P. G.;
Monahan, F. J.; O´Mara, F. P.; Moloney, A. P. 2009. Colour of bovine
subcutaneous adipose tissue: A review of contributory factors, associations
with carcass and meat quality and its potential utility in authentication of
dietary history. Meat Science. 81: 28-45. https://doi.
org/10.1016/j.meatsci.2008.06.013
10. Garcia, P. T.;
Pensel, N. A.; Sancho, A. M.; Latimori, N. J.; Kloster, A. M.; Amigone, M. A.;
Casal, J. J. 2008. Beef lipids in relation to animal breed and nutrition in
Argentina. Meat Science. 79: 500-508. https://doi.org/10.1016/j.meatsci.2007.10.019
11. Holman, B. W. B.; Van de Ven, J. R.; Mao, Y.; Coombs, C. E.
O.; Hopkins, D. L. 2017. Using instrumental (CIE and reflectance) measures to
predict consumers’ acceptance of beef colour. Meat Science. 127: 57-62.
http://dx.doi.org/10.1016/j.meatsci.2017.01.005
12. Horneck, W. H.;
Miller, R. O. 1998. Determination of total nitrogen in plant tissue. In: Kalra,
Y. P. (Ed.) Handbook of reference methods for plant analysis. Soil and Plant
Analysis Council. Inc. CRC Press. 75-83.
13. Hughes, J.;
Clarke, F.; Purslow, P.; Warner, R. 2017. High pH in beef longissimus
thoracis reduces muscle fibre transverse shrinkage and light scattering
which contributes to the dark colour. Food Research International. 101:
228-238. http://dx.doi.org/10.1016/j.
foodres.2017.09.003
14. INTA-SEAG
Córdoba. 1978. Carta de suelos de la República Argentina. Hoja 3363-17 Marcos
Juárez. Buenos Aires. 96p.
15. Ioele, J. P.;
Videla Mensegue, H.; Salafia, A.; Genero, M.; Segura, L.; Galarza, C.; Masino,
A.; Chiacchiera, S.; Pietrantonio, J.; Alladio, M.; Anselmi, H.; Feresín, P.;
Pagnan, F.; Canale, A.; Salomon, A.; Muñoz, S.; Alberione, E.; Conde, B.;
Gerster, G. 2021. Red de evaluación de híbridos de maíz de fecha de siembra
temprana del Centro Sur de Córdoba. Campaña 2020-21. INTA EEA Marcos Juárez,
Informe técnico. https://inta.gob.ar/documentos/
red-de-evaluacion-de-hibridos-de-maiz-de-fecha-de-siembra-tempranadel-centro-sur-de-cordoba-campana-2020-21
16. Kloster, A. M.;
Latimori, N. J.; Amigone, M. A.; Garis, M. H.; Chiacchiera, S.; Bertram, N.
2010. Invernada intensiva de biotipos británicos y cruzas continentales sobre
pasturas de alfalfa y gramíneas. INTA EEA Marcos Juárez. Informe de
Investigación N° 6. 17p.
17. Kloster, A. M.;
Latimori, N. J.; Zurbriggen, G. A.; Garis, M. H. 2017. Comparación de dos
alternativas de invernada intensiva. Información para extensión en línea, EEA
Marcos Juárez, 25. http://hdl.handle.net/20.500.12123/12280
18 Lancaster, P.
A.; Krehbiel, C. R.; Horn, G. W. 2014. A meta-analysis of effects of nutrition
and management during the stocker and backgrounding phase on subsequent
finishing performance and carcass characteristics. The Professional Animal
Scientist. 30: 602-612. https://doi.org/10.15232/pas.2014-01330
19. Latimori, N.
J.; Kloster, A. M.; Amigone, M. A. 2000. Invernada corta de novillos Holando
Argentino en sistemas pastoriles de alta productividad. EEA INTA Marcos Juárez.
Informe técnico. 127: 8p.
20. Latimori, N.
J.; Kloster, A. M.; García, P. T.; Carduza, F. J.; Grigioni, G.; Pensel, N. A.
2008. Diet and genotype effects on the quality index of beef produced in the
Argentine Pampeana region. Meat Science. 79: 463-469.
https://doi.org/10.1016/j.meatsci.2007.10.008
21. Latimori, N.
J.; Kloster, A. M.; Carduza, F.; Vissani, R.; Garis, M. H. 2016. Efectos del
plano nutricional durante la recría sobre el desempeño productivo de novillos
Holando Argentino. EEA INTA Marcos Juárez. Información para extensión. 147: 9
p.
22. Maglietti, C.;
Pavan, E. 2019. Módulo de invernada intensiva y calidad de producto. En:
Pasinato, A.; Grigioni, G.; Alende, M. (Eds.). Producción bovinos para carne:
2013-2017. Sistemas de Producción, Bienestar Animal y Calidad de Producto.
Anguil, Ediciones INTA. 103-107.
23. MAGyP; MEcon.
2014. Ministerio de Agricultura, Ganadería y Pesca; Ministerio de Economía y
Finanzas Públicas. Resolución conjunta N° 466/2014 y 361/2014. Buenos Aires,
Argentina.
24. Manni, K.;
Rinne, M.; Huhtanen, P. 2013. Comparison of concentrate feeding strategies for
growing dairy bulls. Livestock Science. 152: 21-30.
http://dx.doi.org/10.1016/j.livsci.2012.12.006
25. Manni, K.;
Rinne, M.; Huuskonen, A.; Huhtanen, P. 2018. Effects of contrasting concentrate
feeding strategies on meat quality of growing and finishing dairy bulls offered
grass silage and barley based diets. Meat Science. 143: 184-189. https://doi.org/10.1016/j. meatsci.2018.04.033
26. Mcleod, M. N.;
Minson, D. J. 1976. The analytical and biological accuracy of estimating the
dry matter digestibility of different legume species. Animal Feed Science and
Technology. 1: 61-72. https://doi.org/10.1016/0377-8401(76)90008-0
27.Melucci, L. M.;
Panarace, M.; Feula, P.;Villarreal, E. L.; Grigioni, G.; Carduza, F.; Soria, L.
A.; Mezzadra, C. A.; Arceo, M. E.; Papaleo Mazzucco, J.; Corva, P. M.;
Irurueta, M.; Rogberg-Muñoz, A.; Miquel, M. C. 2012. Genetic and management
factors affecting beef quality in grazing Hereford steers. Meat Science. 92:
768-774. https://doi.org/10.1016/j.meatsci.2012.06.036
28. Merayo, M.;
Pighin, D.; Cunzolo, S.; Veggetti, M.; Soteras, T.; Chamorro, V.; Pazos, A.;
Grigioni, G. 2023. Meat quality traits in beef from heifers: Effect of
including distiller grains in finishing pasture-baseddiets. Agriculture.
13:1977. https://doi.org/10.3390/agriculture13101977
29. Miller, M. F.;
Carr, M. A.; Ramsey, C. B.; Crockett, K. L.; Hoover, L. C. 2001. Consumer
thresholds for establishing the value of beef tenderness. Journal of Animal
Science. 79: 3062-3068. https://doi.org/10.2527/2001.79123062x
30. Morales Gómez,
J. F.; Antonelo, D. S.; Beline, M.; Pavan, B.; Bambil, D. B.; Fantinato Neto,
P.; Saran Netto, A.; Leme, P. R.; Goulart, R. S.; Gerrard, D. E.; Silva, S. L.
2022. Feeding strategies impact animal growth and beef color and tenderness.
Meat Science. 183: 108599. https:// doi.org/10.1016/j.meatsci.2021.108599
31. NRC. 1996.
Nutrient Requirements of Beef Cattle. National Academy Press: Washington DC.
32. O’Quinn, T. G.;
Legako, J. F.; Brooks, J. C.; Miller, M. F. 2018. Evaluation of the
contribution of tenderness, juiciness, and flavour to the overall consumer beef
eating experience. Translational Animal Science. 2: 26-36.
https://doi.org/10.1093/tas/txx008
33. Page, J. K.; Wulf, D. M.; Schwotzer, T. R. 2001. A survey of
beef muscle color and pH. Journal of Animal Science. 79: 678-687. https://doi.org/10.2527/2001.793678x
34. Pethick, D. W.;
Harper, G. S.; Oddy, V. H. 2004. Growth, development and nutritional
manipulation of marblingin cattle: a review. Australian Journal of Experimental
Agriculture. 44(7):705-715. https://doi.org/10.1071/EA02165
35. Platter, W. J.;
Tatum, J. D.; Belk, K. E.; Chapman, P. L.; Scanga, J. A.; Smith, G. C. 2003.
Relationships of consumer sensory ratings, marbling score, and shear force
value to consumer acceptance of beef strip loin steaks. Journal of Animal
Science. 81: 2741-2750. https://doi. org/10.2527/2003.81112741x
36. Savell, J. W.;
Mueller, S. L.; Baird, B. E. 2005. The chilling of carcasses. Meat Science. 70:
449-459. https://doi.org/10.1016/j.meatsci.2004.06.027
37. Slabbert, N.;
Campher, J. P.; Shelby, T.; Leeuw, K. J.; Kühn, G. P. 1992. The influence of
dietary energy concentration and feed intake level on feedlot steers 3. Carcass
composition and tissue growth as influenced by rate of gain. South African
Journal of Animal Sciences. 22(4): 115-121.
38. Testa, M. L.
2017. Efecto de la dieta con alto contenido de almidón al inicio de recría o en
terminación sobre descriptores de la grasa subcutánea e intramuscular. Tesis de
Maestría en Producción Animal. Facultad de Ciencias Agrarias. Universidad Nacional
de Mar del Plata. Balcarce. Argentina. 43 p.
39. Testa, M. L.;
Grigioni, G.; Panea, B.; Pavan, E. 2021. Color and marbling as predictors of
meat quality perception of Argentinian consumers. Foods. 10: 1465.
https://doi.org/10.3390/ foods10071465
40. Thompson, J. M.
2004. The effects of marbling on flavour and juiciness scores of cooked beef,
after adjusting to a constant tenderness. Australian Journal of Experimental
Agriculture. 44: 645-652. https://doi.org/10.1071/EA02171
41. Van Soest, P.
J.; Robertson, J. B.; Lewis, B. A. 1991. Methods for dietary fiber, neutral
detergent fiber, and nonstarch polysaccharides in relation to animal nutrition.
Journal of Dairy Science. 74: 3583-3597.
https://doi.org/10.3168/jds.S0022-0302(91)78551-2
42. Volpi Lagreca,
G.; Gelid, L. F.; Alende, M.; Bressan, E. R.; Pordomingo, A. B.; Pordomingo, A.
J. 2021. Effect of placement weight and days on feed on feedlot cattle
performance and carcass traits. Livestock Science. 244: 104392.
https://doi.org/10.1016/j.livsci.2020.104392
43. Zurbriggen, G.
A.; Maglietti, C. S.; Pouzo, L. B.; Testa, M. L.; Riffel, S.; Elizalde, J. C.;
Pavan, E. 2022. Extending the feeding period beyond 8.0 mm of subcutaneous fat
reduces feed efficiency without improving meat colour and tenderness of
non-implanted feedlot steers. Journal of Animal and Feed Sciences. 31(4):
360-370. https://doi.org/10.22358/jafs/151153/2022
Funding
This study was partially funded by the Instituto de Promoción de
la Carne Vacuna Argentina.