Revista de la Facultad de Ciencias
Agrarias. Universidad Nacional de Cuyo. En prensa. ISSN (en línea) 1853-8665.
Original article
Net
protein requirements for maintenance and weight gain in male guinea pigs (Cavia
porcellus) of the Peru breed
Requerimientos
de proteína neta para mantenimiento y ganancia de peso en cuyes machos (Cavia
porcellus) de la raza Perú
William Armando
Tapie Canacuan1,
Sandra Lucia
Posada-Ochoa2,
Jaime Ricardo
Rosero-Noguera2
1 Universidad
Católica de Oriente. Grupo de Investigación GIAZ. AA 008. Rionegro. Colombia.
2 Universidad de Antioquia. Facultad de Ciencias Agrarias. Grupo
de Investigación en Ciencias Agrarias-GRICA, AA 1226. Medellín-Colombia.
* watapiec@unal.edu.co
Abstract
Net protein
requirements for weight gain (NPg)
and maintenance (NPm)
in meat-producing guinea pigs are not yet established. The objective of this
study was to estimate the requirements for NPm and NPg in male guinea pigs of
the Peru breed using the comparative slaughter method. Sixty guinea pigs with
an initial body weight (BW) of 393 ± 55 g were distributed in five groups of 12
animals. The animals were fed a pelleted diet. At the beginning of the
experiment, a reference group with a BW 385.9 ± 44.5 g was slaughtered. Two
groups were fed ad libitum, another group received 75% of the feed
provided to the ad libitum groups, and a fifth group was kept at the
maintenance level. One of the ad libitum-fed groups was slaughtered when
its BW reached 846.6 ± 48 g. The other animals, distributed according to their
feeding level, were slaughtered when the second ad libitum-fed group
reached 1197 ± 84 g BW. The NPm requirement was 3.97
g/kg/EBW0.75 (empty body weight). And
the requirement was NPg 2.5 g/kg EBW0.75. The protein
use efficiency was 0.629.
Keywords: crude protein,
retained protein, digestible protein, requirement protein
Resumen
Los
requerimientos de proteína neta para ganancia de peso (PNg) y
mantenimiento (PNm) en cuyes de producción de carne aún no han sido
establecidos. El objetivo fue estimar los requerimientos de PNm y PNg
en cuyes machos de la raza Perú utilizando la metodología de sacrificio
comparativo. Se utilizaron 60 cuyes con un peso vivo (PV) inicial de 393 ± 55
g, distribuidos en cinco grupos de 12 animales. Los animales se alimentaron con
una dieta peletizada. Al inicio del experimento, se sacrificó un grupo de
referencia con un PV 385,9 ± 44,5 g. Dos de los grupos fueron alimentados ad
libitum, mientras que a otro grupo se le proporcionó el 75% en comparación
con los que tenían acceso ad libitum, y un quinto grupo se mantuvo en el
nivel de mantenimiento. Uno de los grupos que tuvo acceso ad libitum fue
sacrificado cuando su PV alcanzó 846,6 ± 48 g. Los demás animales, distribuidos
según su nivel de alimentación, fueron sacrificados cuando el otro grupo con
acceso ad libitum alcanzó 1197 ± 84 g PV. El requerimiento de PNm
fue 3,97 g/kg/PCV0,75 (peso corporal vacío)
y PNg 2,5 g/kg/PCV0,75. La eficiencia de utilización de
proteína fue 0,629.
Palabras
clave: proteína cruda, proteína retenida, proteína digestible,
requerimiento de proteína
Originales: Recepción: 18/08/2024 - Aceptación: 25/02/2025
Introduction
The
guinea pig (Cavia porcellus) is an herbivorous, monogastric mammal
native to Peru, Ecuador, Bolivia, and Colombia, where it is primarily raised
for meat production (5).
In these countries, the demand for guinea pig meat has increased due to its
nutritional quality, palatability, and, above all, the population’s consumption
habits (10).
Its production has spread to countries such as Brazil, Cameroon, the Democratic
Republic of Congo, Tanzania, and Mexico (3,
26, 35). Guinea pig farming has contributed to improved family diets,
food security, and overall economic conditions (10).
However,
guinea pig production as a food source is relatively unknown worldwide (7).
Guinea pigs have been used for scientific research (27)
or as pets, and some of the available reference information on husbandry and
diet is based on work under laboratory conditions (18 Since meat-producing
guinea pigs have higher productive yields, these recommendations are not
applicable (6, 8).
Thus, the information available on nutritional requirements for maintenance and
weight gain of this species is limited with little or no research available (19,
27). Protein requirements can be divided into maintenance and
weight gain and are the fundamental components of muscle tissue, certain
hormones, and all enzymes (23).
Proteins and amino acids are indispensable nutrients for guinea pig
performance. If guinea pigs do not receive adequate protein, they do not
achieve the growth potential characteristic of their breed (32).
In addition, the protein deposition of an animal is considered the most
important determinant for weight gain, due to the high water content of
protein-rich tissues (33).
Usually,
rations for guinea pigs are formulated with the 18% crude protein (CP)
recommended by the NRC (1995)
for laboratory animals. In some cases, because the rabbit is a species with
digestive anatomy and physiology similar to that of guinea pigs, comparisons
have been made in terms of feeding and nutrient utilization efficiency at the
digestive level (34, 36).
So far, no studies report nutritional requirements discriminated in maintenance
requirements and weight gain in guinea pigs for meat production (32).
Based on the above aspects, this study aimed to determine the protein requirements
for maintenance and weight gain in male guinea pigs of the Peru breed.
Material and methods
Animal
ethics: The experiment was approved by the Ethics Committee for Animal
Experimentation of the University of Antioquia (Act N°138 of 09 February 2021).
Housing and handling of animals
A
total of 60 male guinea pigs of the Peru breed were used. All animals were
given a 20-day acclimation period to adapt to handling and the experimental
diet. During the entire experimental period, the animals were housed in
individual metabolic cages 0.3 m long x 0.3 m wide x 0.25 m high, which were
equipped with an automatic feeder and drinker The average temperature was 18°C,
with a relative humidity of 80%, annual precipitation of 2304 mm, and an
altitude of 2150 meters above sea level (masl). The experiment began when the
animals were 35 days old and had an initial body weight (BW) of 393 ± 55 g. The
animals were weighed every seven days to monitor daily weight gain (DWG) to the
amount of feed to be fed.
Diet and dietary levels
Animal
diet was balanced according to the NRC’s (1995)
report. Although this report suggests the inclusion of wheat (23.6%) and whole
oats (25.2%); for reasons of availability, it was decided to replace them with
rice and corn meal (table 1),
respectively. The feed was provided in pellet form twice daily, at 7:00 and
15:00 h.
Table 1. Ingredients
and percentage composition on a dry basis of the experimental diet.
Tabla 1. Ingredientes
y composición porcentual en base seca de la dieta experimental.
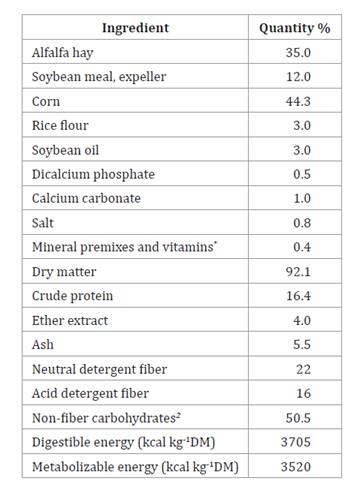
*Minerals: cobalt 1.5; copper
6.6; manganese 39.7; zinc 19.8; iodine 1.1; iron 50; selenium 0.3 (mg kg-1).
Vitamins: vitamin A 6614; vitamin D3 2200 (IU kg-1), vitamin E 22; vitamin K 5; thiamine
4.4; riboflavin 3.3; niacin 11; pantothenic acid 11; choline 529; pyridoxine 5;
folic acid 4.8; biotin 2.2; ascorbic acid 250; methionine hydroxy analog 500
(mg kg-1);
vitaminB12 11 μg kg-1.
Antioxidant BHT 0.1 g kg-1; Salinomycin 20 mg kg-1. Source NRC (1995). 2 CNF=100%- (Crude
protein+Ether extract+Ash+Neutral detergent fiber).
*Minerales:
cobalto 1,5; cobre 6,6; manganeso 39,7; zinc 19,8; yodo 1,1; hierro 50; selenio
0,3 (mg/kg). Vitaminas: vitamina A 6614; vitamina D3 2200 (UI/kg), vitamina E
22; vitamina K 5; tiamina 4,4; riboflavina 3,3; niacina 11; ácido pantoténico
11; colina 529; piridoxina 5; ácido fólico 4,8; biotina 2,2; ácido ascórbico
250; metionina hidroxi análogo 500 (mg/kg); vitamina B12 11 μg/kg. Antioxidante
BHT 0,1 g/kg; Salinomicina 20 mg/kg. Fuente NRC (1995). 2 CNF=
100%-(Proteína bruta+Extracto Etéreo+Cenizas+Fibra detergente neutra)
The
diet was provided at three levels: ad libitum feeding (24 animals),
where feed rejected (orts) accounted for 20% of the offered amount; restricted
feeding (12 animals), with intake set at 75% of the ad libitum level; and
maintenance feeding (12 animals), based on an intake of 150-160 kcal DE kg-1
BW0.75,
which is 30-40% higher than the 115.2 kcal DE kg-1 BW0.75 reported by Matin
et al. (1975) for laboratory guinea pigs. The DE was considered 95% of ME,
following Xiccato and Trocino (2020);
the EM was calculated using the diet composition values (table 1).
Then, the diet energy density was estimated at 3705 kcal DE kg-1.
The described feeding levels are necessary to establish energy requirements,
using linear regression, according to comparative slaughter method (22).
Digestibility test
To
determine the retained protein (RP) and crude protein (CP) losses associated
with the digestive process, an apparent digestibility test was performed 28
days after the start of the experiment at three feeding levels (ad libitum,
restricted, maintenance) with six animals each. The test lasted six days. Dry
matter intake (DMI) was calculated as the difference between the amount of feed
offered and the amount rejected by the animals. Each day, the rejected feed per
animal was weighed and stored at -15°C, thus obtaining an individual composite
sample for subsequent chemical analysis. Fecal dry matter production was
determined by the total fecal collection procedure. Each day, in the morning
and the afternoon, the feces were removed from the collection tray, stored
individually, and frozen at -15°C.
Urine collection
Simultaneously
with the digestibility test, total urine collection was performed. Urine was
stored in containers containing 5 ml of sulfuric acid (5% H2SO4)
to avoid nitrogen (N) losses in the form of ammonium and was stored at -15°C.
Urinary weight and volume were recorded daily. At the end of the six days,
urine samples were pooled to obtain a composite sample per animal for
subsequent chemical analysis.
Slaughter of animals
The
60 guinea pigs were divided into five groups of twelve animals each and were
slaughtered in three periods. The first group was slaughtered at the beginning
of the experiment with a BW of 385.9 ± 44.5 g. This group was designated as the
reference group, allowing for the estimation of the initial composition of the
48 animals culled later, facilitating the comparison of the final body
composition with the initial composition. Twenty-eight days after the
experiment began, a second group of 12 animals fed ad libitum with a BW
of 846.6 ± 48 g was culled, marking this point as the intermediate slaughter.
Finally, the remaining 36 animals, 12 per feeding level (ad libitum,
restricted, and maintenance), were culled at 90 days, when one of the ad
libitum-fed groups reached a BW of 1189.7 ± 105 g. Before slaughter, the
animals were subjected to an 18-hour fasting, after which they were weighed to
determine the shrunk body weight (SBW). For slaughter, a Dick KTBG captive bolt
pistol (Friedr Dick GmbH & Co. Deizisau, Germany) was used. The procedure
followed the method described by Limon et al. (2016).
Immediately after the stunning, the jugular veins were bilaterally severed and
blood was collected. Animals were depilated by exposing to water heated to 90°C
for 10 seconds. Then, after weighting, gastrointestinal contents were removed.
Empty body weights (EBW) were determined by the difference between the SBW and
the weight of the gastrointestinal contents. Hair, blood, and body plus organs
(BO) were stored separately at -15°C for later chemical analysis.
Chemical analysis
The
BO was ground in a mill model ML C012 (capacity 150kg h-1, power
850W, voltage 110). In the offered and orts, feces, BO, hair, and blood were
analyzed for DM (AOAC 2007; Method 39.1.02), ether extract (AOAC 2007; Method
39.1.05), CP (AOAC 2007; Method 39.1.19), ash (AOAC 2007; Method 39.1.09) and
gross energy (GE) (LECO AC600 calorimetric pump, MI, USA). Only DM, CP, and GE
were analyzed in the urine samples. The results for the body plus organs, hair,
and blood were summed to obtain the body’s chemical composition at each
slaughter.
Crud protein balance
Each
animal’s CP intake (CPI) was determined by the difference between the amount of
CP offered and rejected. Digestible protein intake (DPI) was obtained by
comparing CPI and CP losses through feces. In the protein balance, RP was
estimated by the difference between CPI and losses through urine and feces. In
the comparative slaughter trial, the RP was obtained by the difference between
the body RP at the time of slaughter and the beginning of the study, based on
the body composition of the reference animals. Crud protein balance results
were expressed in g/kg/EBW0.75. The EBW value corresponded to the
mean weight, obtained as (initial EBW + final EBW/2).
Net protein requirements for weight gain (NPg) and
maintenance (NPm)
The
NPg (g/kg EBW0.75/day) corresponded to the average RP in
animals fed ad libitum throughout the entire experimental period. From
the regression parameters: 𝑙𝑜𝑔𝑦 = 𝑎 + 𝑏 ∗ 𝑙𝑜𝑔𝑥, where: y =
log10 of total CP content and x = log10 of EBW.
The net protein requirement per kg EBW was calculated by the derivative of the
above equation, according to the following model (2): 𝑦` = 𝑏 ∗10𝑎 ∗(𝑏−1),
where: y` = NPg required to gain one kg of EBW (g/kg/EWG/day)
and x =EBW (kg). The equations were constructed with the information
from the 24 animals fed ad libitum and the 12 animals from the
restricted feeding level. The NPm requirement was estimated using
linear regression equations between retained nitrogen (RN, g/kg EBW0.75/day)
in the EBW of the animals during the experimental period (y) as a function of
nitrogen intake (NI, g/kg EBW0.75/day) from the diet (x). To
estimate the dietary CP requirement for maintenance (CPm), the
intersection with the X-axis was multiplied by a factor of 6.25. Endogenous and
metabolic losses were estimated based on the negative intersection with the
Y-axis, while the slope of the line was considered as the efficiency of
nitrogen utilization from the feed (16).
The digestible protein requirements for maintenance (DPm) and
digestible protein for weight gain (DPg) were estimated by the ratio
of the CP digestibility coefficient. The conversion of the EBW requirement into
a BW requirement was carried out using the factor derived from the BW/EBW
ratio.
Statistical analysis
The
results of the metabolism trial were analyzed using a completely randomized
design through analysis of variance, considering the feeding level
(maintenance, restricted, and ad libitum) as a fixed effect with six
animals per group. Means were compared using Tukey’s test, with statistical
differences considered significant at p < 0.05. In the linear regression
analyses conducted with the data obtained from the comparative slaughter trial,
the significance (p < 0.05) of the slope and intercept in each model was
verified. Data processing was performed using the R statistical package (29).
Results
Protein balance and body composition
Table
2 presents the CP balance data for the three feeding levels:
maintenance, restricted, and ad libitum. DMI and CPI were significantly
higher in animals fed ad libitum (p < 0.05).
Table 2. Protein
partitioning in ad libitum, restricted, and maintenance-fed guinea pigs.
Tabla 2.
Partición de proteína en cuyes alimentados ad libitum, restringidos y de
mantenimiento.

BW = body weight; DMI = dry
matter intake; CP =crude protein; DPI = digestible protein intake; CPI =crude
protein intake; RP = retained protein; EBW =empty body weight; DP = digestible
protein. a,b,c Averages within
the same row with different letters differ (p < 0.05).
PVC
= peso vivo corporal; CMS = consumo de materia seca; PC = Proteína cruda; CPD =
consumo de proteína digestible; CPC = Consumo de proteína cruda; PR = Proteína
retenida; PCV = peso corporal vacío; PD = proteína digestible, a,b,c Promedios
dentro de la misma fila con letras diferentes difieren (p < 0,05).
Protein
digestibility was significantly lower in animals fed ad libitum (p<0.05).
The percentage of RP estimated in the digestibility test decreased as CPI
increased (p<0.05). CP in feces differed with feeding level (p<0.05).
When the percentage of CPI in urine was compared to DPI and CPI, no differences
were present.
Comparative slaughter trial
Table
3 shows weight and body composition at slaughter for three
feeding levels and a reference group of animals slaughtered at the beginning of
the experiment.
Table 3. Body
composition at slaughter with three feeding levels in guinea pigs.
Tabla 3. Composición
corporal al sacrificio bajo tres niveles de alimentación en cuyes.
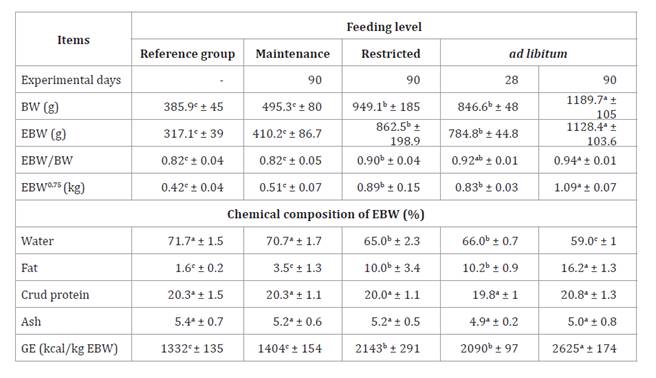
BW = body weight; EBW =empty body
weight; BW0.75 =
metabolic empty body weight; GE =gross energy, a,b,c Averages
within the same row with different letters differ (p < 0.05).
PVC
=peso vivo corporal; PCV =peso corporal vacío; PCV0.75 = peso corporal vacío metabólico; EB =energía
bruta, a,b,c Promedios dentro de la misma fila con letras
diferentes difieren (p < 0,05).
The
average BW of the restricted-fed animals represented about 80% of the BW of the
ad libitum animals. The EBW/BW ratio, fat, and BW increased with feeding
level (p<0.05), while water content decreased (p<0.05). CP and ash were
stable, with values close to 20, and 5%, respectively.
Table
4 presents the results of comparative slaughter at the different
feeding levels (ad libitum, restricted, maintenance).
Table 4. Daily
weight gain, protein intake, and crud protein balance in guinea pigs across
three feeding levels: results from a comparative slaughter study.
Tabla 4. Ganancia
diaria de peso, consumo y balance de proteína cruda en cuyes bajo tres niveles
de alimentación: resultados del estudio de sacrificio comparativo.
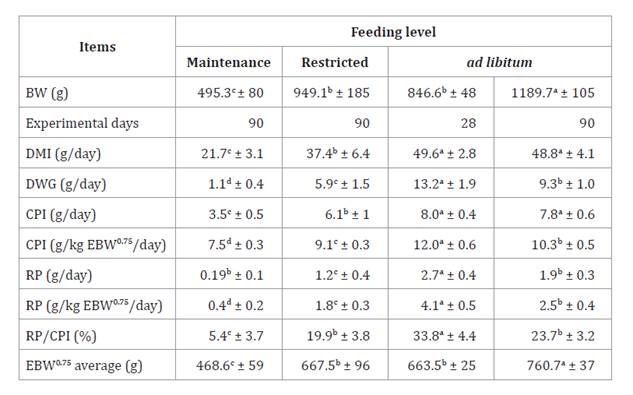
BW = body weight; DMI =dry matter
intake; EBW =empty body weight; DWG = daily weight gain; CPI = crude protein
intake; RP =retained protein.
PVC
=peso vivo corporal; CMS = consumo de materia seca; PCV = peso corporal vacío;
GPD = ganancia de peso diaria; CPC = consumo de proteína cruda; PR = proteína
retenida, a,b,c Promedios dentro de la misma fila con letras
diferentes difieren (p < 0,05).
DWG
was proportional to feeding level. ad
libitum-fed animals were found to have higher DWG and to be more efficient
in RP at an average weight of 846.6 g, at 28 experimental days. The average RP
of animals fed ad libitum and slaughtered at 90 days was considered the
requirement NPg (2.5 g/kg BW0.75/day).
Net protein requirement for weight gain and maintenance
Table
5 shows the equations used to estimate the NPg
requirement and the EBW. The equations exhibited a good fit with determination
coefficients exceeding 0.93 (R2).
Table 5. Equations
for estimating empty body weight and net protein requirement for weight gain in
guinea pigs.
Tabla 5. Ecuaciones
para estimar el peso corporal vacío y el requerimiento de proteína neta para la
ganancia de peso en cuyes.

EBW (kg) =empty body weight; BW
(kg) = body weight; NP = net protein.
PCV
(kg) = peso corporal vacío; PVC (kg) = peso vivo corporal; PN = proteína neta.
With
the equation to estimate the NPg requirement and the equation to
estimate the BW (table 5). The NPg
requirements for different BW (900, 1000, 1100, and 1200 g) were expressed in
different DWG (5, 10, 15, and 20 g) (table 6).
Table 6. Net
protein requirements for weight gain in guinea pigs.
Tabla 6. Requerimientos
de proteína neta para la ganancia de peso en cuyes.
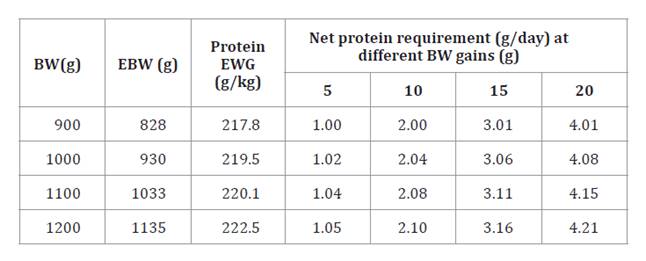
BW = body weight; EBW =empty body
weight; EWG =empty body weight gain.
PVC
=peso vivo corporal; PCV =peso corporal vacío; GPC = ganancia de peso corporal
vacío.
Figure
1 shows the relationship between NI and RN, both variables
expressed in g.kg-1 EBW0.75 d-1. The
regression was constructed with animal data at the three feeding levels (ad
libitum, restricted, and maintenance).
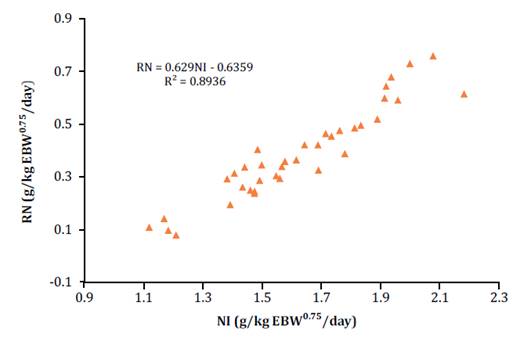
Figura 1.
Relación entre el consumo de nitrógeno (CN g/kg PCV0.75/día) y nitrógeno retenido (NR g/kg
PCV0.75/día).
Figure 1. Relationship
between nitrogen intake (NI g/kg EBW0.75/day) and nitrogen retained (RN g/kg
EBW0.75/day).
From
the equation in figure 1, NI was estimated when
the RN was zero, corresponding to the N requirement for maintenance (1.01 g).
This requirement was expressed in CPm when multiplied by the factor
6.25 (6.32 g/kg/EBW0.75/day). On the other hand, the regression
intercept corresponded to endogenous and metabolic N losses (0.6359 g/kg EBW0.75/day)
and its slope represented the N utilization efficiency (0.629). Based on this
efficiency, the NPm requirement was determined to be 3.97 (g/kg/EBW0.75/day).
With the protein digestibility coefficient found in the digestibility test at
the maintenance level (84.5 %), the DPm was estimated at 5.34 g/kg
EBW0.75/day.
Table
7 presents the requirements of NPm,
NPg, total NP,
DPm, DPg, total DP, and
total CP, for different BW gains (5, 10, 15, and 20 g/day) for animals of 900,
1000, 1100, and 1200 g of BW. Protein maintenance and gain increased as BW is
higher and DWG increases.
Table 7.
Protein requirements (g/day): net (NP), digestible (DP), and crude (CP), for
maintenance (m),
gain (g),
and total for guinea pigs.
Tabla 7.
Requerimientos de proteína (g/día): neta (NP), digestible (DP) y cruda (CP),
para mantenimiento (m), ganancia (g) y total para cuyes.
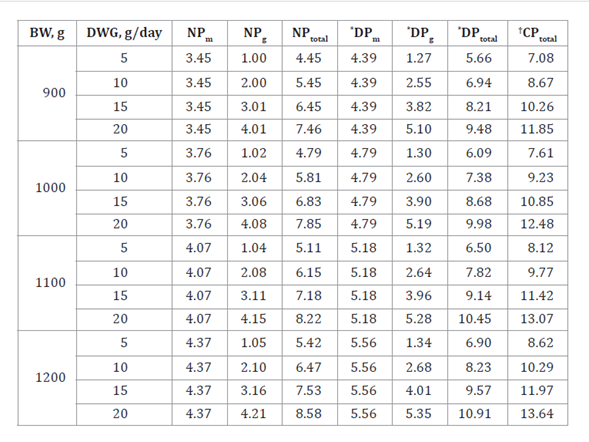
BW = body weight; DWG = daily
weight gain; * value
calculated with the average protein digestibility coefficient of 80%; † value
calculated with the protein utilization efficiency coefficient of 62.9%.
PVC
= peso vivo corporal; GPC = ganancia de peso corporal vacío; * valor calculado con el coeficiente de
digestibilidad promedio de la proteína del 80%; † valor calculado con el coeficiente de
eficiencia de uso de la proteína del 62.9%.
Discussion
Protein balance
Since
CP losses in the feces increased with the feeding level (p<0.05) due to a
higher intake, DP decreased. When comparing ad libitum and maintenance
levels, an average variation of 9.1 percentage units in DP was observed (p<0.05).
A lower DMI at the maintenance level may have prolonged the retention time of
the feed in the gastrointestinal tract, which extends the period of exposure of
the feed to digestive enzymes, thus facilitating feed absorption (17),
which was finally reflected in higher protein digestibility. In general, a high
protein digestibility was observed, 75.4% in ad libitum and 84.5% in the
maintenance group. Similar findings have been recorded in the DP (77.02 to
86.56%) of whole soybean meal in guinea pigs of the Peru breed (11).
According to Chauca (1997),
the guinea pig demonstrates a remarkable efficiency in the digestion of CP
present in energy and protein foods compared to other monogastric species,
thanks to its digestive physiology, which involves a first stage of enzymatic
digestion in the stomach followed by a microbial phase in the cecum and colon.
In a study with male guinea pigs, 63 feeds classified
into five categories were evaluated (1, dry forages; 2, green forages; 3,
agro-industrial and kitchen waste; 4, energy meals; 5, protein meals of animal
and vegetable origin), an average DP of 73.53% was found (7).
The higher digestibility observed in our study could be attributed to the
quality of the feed used (table 1).
Crude
protein losses in urine for guinea pigs with balanced feed intake have been
estimated at 2.8 g/day (25), which
value differs considerably from the value of 0.09 g/day found in this study,
with a diet containing 16.4% CP (table 1).
This difference can be attributed to the higher CP content in the diet (18.3 %)
and higher DMI (49.49 g/day) reported by Bastianelli and
Sauvant (1997). In rabbits, Lv et al. (2009)
found that RP does not improve with increasing CP levels from 12 to 20% in the
diet, which is ultimately reflected in higher CP excretion in feces and urine
and low efficiency as CP supply increases. Because CP in urine and feces were
lower at the maintenance level, RP (RP/CPI%) was higher, suggesting that
animals use protein more efficiently under limited feeding conditions. Moon
(1988) reports higher metabolic efficiency in guinea pigs under
fasting conditions than other rodents.
Net weight gain protein
The NPg
requirement was 2.5 g/kg EBW0.75/day. The higher DWG of 13.2 g/day
observed in the ad libitum animals of intermediate slaughter (846.6 g of
BW), was related to the higher protein deposition (2.7 g/day) found in this
same group of animals (table
4),
this is due to the high content of water and protein in the tissues, which
largely determines the DWG in an animal (4). This was also
evidenced by the higher efficiency in the RP (33.8%) at 28 days of performance
compared to the efficiency in the ad libitum animals at the final
slaughter (23.7%). This is because as the guinea pig reaches the adult stage,
it accumulates more fat than protein. According to De Figueiredo et al. (2020), the fat content
of guinea pig meat is inversely proportional to the water and protein content.
This was demonstrated by the body composition of reference animals versus ad
libitum slaughter animals, in which fat content increased from 1.6
to 10.2 and 16.2 % as water content decreased from 71.7 to 66.0 and 59.0% for
the reference animals and the two ad libitum groups, respectively (table 3). Similar body
composition trends are reported at three months of age (water 75%, protein 19%,
and fat 2.64%) versus the body composition of guinea pigs at 18 months of age
(water 72.6%, protein 19.6% and fat 5.7%) (31). NPg
requirements showed low variation, with values between 21.8 to 22.3 g/100 g for
828 to 1135 g of EBW, respectively (table 6). Studies reveal
that protein in guinea pigs for meat production is very stable and even between
the lines and age of the animal; Peru breed 19.34% (18), Inka and Andean
20.36 and 19.26% CP respectively (31). It has been shown
that guinea pigs respond efficiently with rations of 20% CP and that higher
levels have no beneficial effect on growth (37).
Net maintenance protein and use efficiency
Endogenous
and metabolic losses of N were estimated at 0.6359 g/kg EBW0.75. In
rabbits with a BW between 2.1 to 2.8 kg and diets with a CP between 12 to 20 %,
an endogenous N value of 0.485 g/kg BW0.75 has been reported (23),
23.7% higher than that found in this study. In contrast, in rabbits (New
Zealand White x Californian) with a BW of 3.79 kg and a daily intake of 44.4 g
DM/kg BW0.75 from a protein-free diet, the endogenous N was 0.2539
g/kg BW0.75 (15).
Although there are no reports on endogenous N losses in guinea pigs, the higher
value found in comparison with rabbits suggests that N recycling and protein
turnover may be more efficient in rabbits than in guinea pigs in the conditions
of this study. In guinea pigs, being smaller animals, the amount of endogenous
N is related to protein turnover, which could result in higher metabolic rates
and thus higher endogenous N values (30),
explaining in part the higher losses compared to rabbits.
With
the CP utilization efficiency of 0.629 (figure 1),
an NPm requirement of 3.97 g/kg BW0.75 was estimated. This
value was found to be lower than that reported for growing wool-type rabbits
(4.87 g/kg BW0.75) (21)
and higher than the requirements in growing rabbits (NPm 3.03 g/kg
BW0.75) (23).
Despite the absence of data on NPm requirements in guinea pigs, the
physiological, digestive, and nutritional similarity between rabbits and guinea
pigs (36)
suggests that the data obtained here are biologically consistent. From the
relationship between NI and RN, protein use efficiency values of 0.585 and
0.6781 are reported for growing and finishing rabbits, respectively (23). Xiccato
and Trocino (2020) reported a value of 0.56 for rabbits in general. These values
agree with the 0.629 found in this study (figure 1).
The efficiency observed for guinea pigs and that reported for rabbits is
relatively high compared to other species such as lambs (0.29) (16)
and beef cattle (0.34) (12).
This could indicate that most of the amino acids absorbed from the guinea pig
diet, were available for protein synthesis, rather than being used for other
metabolic processes, such as gluconeogenesis (14).
On
the other hand, based on the protein digestibility coefficient of 84.5%
obtained with the maintenance feeding level (table 2),
the amount of DPm was determined to be 5.34 g/kg EBW0.75.
When comparing this result with the DPm requirements for rabbits in
the growinga nd finishing stages, which were 2.14 and 2.11 g/kg BW0.75
respectively (23),
notable differences exceeding 50% are observed. Parigi-Bini et
al. (1992) report a DPm requirement of 3.8 g/kg BW0.75
for meat production rabbits, the latter value being the closest to the 5.34
found in this study, but still higher by 24%. The higher DPm
requirements in guinea pigs can be attributed to the fact that small
herbivorous mammals such as guinea pigs according to Sakaguchi
(2003) have a higher energy and protein demand per unit of body mass
than larger herbivorous animals such as rabbits. However, it should be noted
that this value can be directly affected by protein digestibility.
Conclusions
The
requirements of NPm and NPg in male guinea pigs of the
Peru breed were 3.97 (g/kg EBW0.75) and 2.5 (g/kg EBW0.75),
respectively. These values exceed some of those proposed for rabbits, but they
align with the concept that small animals have higher requirements in terms of
metabolic weight.
1.
AOAC (Association of Official Analytical Chemists). 2007. 18th ed. Official
methods of analysis of AOAC International. AOAC Int. Gaithersburg. MD.
2.
ARC (Agricultural Research Council). 1980. The nutrient requirements of
ruminant livestock: Technical review. Published on behalf of the Agricultural
Research Council by the Commonwealth Agricultural Bureaux. England. Farnham
Royal.
3.
Ayagirwe, R. B.; Meutchieye, F.; Manjeli, Y.; Maass, B. L. 2018. Production
systems, phenotypic and genetic diversity, and performance of cavy reared in
sub-Saharan Africa: a review. Livestock Research for Rural Development. 30:
1-12. http://www.lrrd.org/lrrd30/6/ ayagi30105.html
4.
Bastianelli, D.; Sauvant, D. 1997. Modelling the mechanisms of pig growth.
Livestock Production Science. 51(1-3): 97-107.
https://doi.org/10.1016/S0301-6226(97)00109-7
5.
Benavides, B.; Cisneros-López, H. D.; Peláez-Sánchez, R. G. 2021. Evidencia
molecular de Leptospira interrogans sensu stricto en Cavia porcellus (cuyes)
destinados para el consumo humano en el municipio de Pasto, Nariño. Universidad
y Salud. 24(1): 55-64. https://doi. org/10.22267/rus.222401.258
6.
Castro, B. J.; Chirinos, P. D.; Calderón Inga, J. 2018. Calidad nutricional del
rastrojo de maca (Lepidium peruvianum Chacón) en cuyes. Revista de
Investigaciones Veterinarias del Perú. 29(2): 410-418.
http://dx.doi.org/10.15381/rivep.v29i2.13405
7.
Castro, B. J.; Chirinos, P. D. 2021. Nutritional value of some raw materials
for guinea pigs (Cavia porcellus) feeding. Translational Animal Science.
5(2): 1-11. https://doi. org/10.1093/tas/txab019
8.
Castro, B. J.; Chirinos, P. D.; Quijada-Caro, E. 2022. Digestible and
metabolizable energy prediction models in guinea pig feedstuffs. Journal of
Applied Animal Research. 50(1): 355-362.
https://doi.org/10.1080/09712119.2022.2079647
9.
Chauca, L. 1997. Producción de cuyes (Cavia porcellus). Roma: Organización de
las Naciones Unidas para la Agricultura y Alimentación (FAO).
http://www.fao.org/docrep/w6562s/ w6562s00.HTM (accessed May 2023).
10.
Chauca, L. 2020. Manual de crianza de cuyes. http://repositorio.inia.gob.pe/
handle/20.500.12955/1077 (accessed May 2023).
11.
Chillpa. C. 2022. Energía y proteína digestibles de la harina integral de soya
(Glycine max) en cuyes (Cavia porcellus L.). Tesis. Universidad
Nacional de San Antonio Abad del Cusco. http://hdl.
handle.net/20.500.12918/6728
12.
Chizzotti, M. L.; Tedeschi, L. O.; Valadares Filho, S. C. 2008. A meta-analysis
of energy and protein requirements for maintenance and growth of Nellore
cattle. Journal of Animal Science. 86(7): 1588-1597.
https://doi.org/10.2527/jas.2007-0309
13.
De Figueiredo, L. B.; Rodrigues, R. T.; Leite, M. F.; Gois, G. C.; Araújo, D.
H.; de Alencar, M. G.; Queiroz, M. A. 2020. Effect of sex on carcass yield and
meat quality of guinea pig. Journal of Food Science and Technology. 57:
3024-3030. https://doi.org/10.1007/s13197-020- 04335-3
14.
Galvani, D. B.; Pires, A. V.; Susin, I.; Gouvêa, V. N.; Berndt, A.; Abdalla, A.
L.; Tedeschi, L. O. 2018. Net protein requirements and metabolizable protein
use for growing ram lambs fed diets differing in concentrate level and roughage
source. Small ruminant research. 165: 79-86. https://doi.org/10.1016/j.smallrumres.2018.05.012
15.
García, A.; De Bias, J.; Carabaño, R. 2004. Effect of type of diet
(casein-based or protein-free) and caecotrophy on ileal endogenous nitrogen and
amino acid flow in rabbits. Animal Science. 79(2): 231-240. https://doi.org/10.1017/S1357729800090093
16.
Gonzaga Neto, S.; Silva Sobrinho, A. G.; Resende, K. T.; Zeola, N. M.; Silva,
A. M., Marques, C. A.; Leão, A. G. 2005. Composição corporal e exigências
nutricionais de proteína e energía para cordeiros Morada Nova. Revista
Brasileira de Zootecnia. 2446-2456. https://doi.
org/10.1590/S1516-35982005000700033
17.
Hidalgo, L.; Víctor, Y.; Valerio, C.; Henry. 2020. Digestibilidad y energía
digestible y metabolizable del gluten de maíz, hominy feed y subproducto de
trigo en cuyes (Cavia porcellus). Revista de Investigaciones
Veterinarias del Perú. 31(2): e17816. https://dx.doi.org/10.15381/
rivep.v31i2.17816
18.
Higaonna, O. R.; Muscari, G. J.; Chauca, F. L.; Astete, F. 2008. Composición
química de la carne de cuy (Cavia porcellus). INIA. Investigaciones en
cuyes, Trabajos presentados a la Asociación Peruana de Producción Animal. Lima,
Perú. Universidad Agraria La Molina.
19.
Keeble, E. 2023. Guinea pig nutrition: what do we know? In Practice. 45(4):
200-210. https://doi. org/10.1002/inpr.309
20.
Limon. G.; Gonzales-Gustavson. E. A.; Gibson. T. J. 2016. Investigation into
the humaneness of slaughter methods for guinea pigs (Cavia porcelus) in
the Andean Region. Journal of Applied Animal Welfare Science. 19(3): 280-293.
https://doi.10.1080/10888705.2016.1 138116
21.
Liu, S. M.; Zhang, L.; Wei, C. M.; Chang, X.; Lu, Y. X.; Peng, D. H. 1991. The
maintenance requirements of protein for Angora rabbits and the efficiency of
digested protein by the rabbits. Chinese Journal of Animal and Veterinary
Sciences. 22: 323-326.
22. Lofgreen, G.
P.; Garrett, W. N. 1968. A system for expressing net energy requirements and
feed values for growing and finishing beef cattle. Journal of Animal science.
27(3): 793-806. https://doi.org/10.2527/jas1968.273793x
23. Lv, J. M.;
Chen, M. L.; Qian, L. C.; Ying, H. Z.; Liu, J. X. 2009. Requirement of crude
protein for maintenance in a new strain of laboratory rabbit. Animal feed
science and technology. 151(3-4): 261-267.
https://doi.org/10.1016/j.anifeedsci.2009.01.001
24. Matin. C. M.;
Ostwald. R. 1975. Food intake and growth of guinea pigs fed a
cholesterol-containing diet. The Journal of Nutrition. 105(5): 525-533.
https://doi.org/10.1093/jn/105.5.525
25. Montalvo, K.
R.; Navarro, M.K. 2012. Determinación de la digestibilidad, energía digestible
y metabolizable de broza de arveja (Pisum Sativum l) y betarraga (Beta
Vulgaris) para la formulación de raciones en la alimentación de cuyes (Cavia
Porcellus). Tesis. Universidad Nacional del centro de Perú.
http://hdl.handle.net/20.500.12894/1954
26. Moon, T. W.
1988. Adaptation, constraint, and the function of the gluconeogenic pathway.
Canadian journal of zoology. 66(5): 1059-1068. https://doi.org/10.1139/z88-156
27. NRC (National
Research Council). 1995. Nutrient requirements of laboratory animals: Fourth
revised edition, 1995. Washington, DC: The National Academies Press.
https://doi. org/10.17226/4758.
28. Parigi-Bini.
R.; Xiccato. G.; Cinetto. M.; Dalle Zotte. A. 1992. Energy and protein
utilization and partition in rabbit does concurrently pregnant and lactating.
Animal Science. 55(1): 153-162. https://doi.org/10.1017/S0003356100037387
29. R Core Team.
2022. R: A lenguage and environment for statistical computing. R foundation for
statistical computing Computing, Vienna. Austria. https://www.R-project.org/
30. Sakaguchi, E.
I. 2003. Digestive strategies of small hindgut fermenters. Animal Science
Journal. 74(5): 327-337. https://doi.org/10.1046/j.1344-3941.2003.00124.x
31. Sánchez-Macías,
D.; Barba-Maggi, L.; Morales-delaNuez, A.; Palmay-Paredes, J. 2018. Guinea pig
for meat production: A systematic review of factors affecting the production,
carcass and meat quality. Meat Science. 143: 165-176.
https://doi.org/10.1016/j.meatsci.2018.05.004
32. Tapie, W. A.;
Posada Ochoa, S. L.; Rosero Noguera, R. 2024a. A theoretical approach to energy
requirements in guinea pigs (Cavia porcellus). Agronomía Mesoamericana.
35:57058. https://doi.org/10.15517/am.2024.57058
33. Tapie, W. A.;
Posada-Ochoa, S. L.; Rosero-Noguera, J. R.; Muñoz-Tamayo, R. 2024b. Desarrollo
de un modelo dinámico mecanicista para predecir el crecimiento de cuyes (Cavia
porcellus) machos del genotipo Perú. Revista De La Academia Colombiana De
Ciencias Exactas, Físicas y Naturales. 48(189): 859-70.
https://doi.org/10.18257/raccefyn.2997
34. Trejo-Sánchez,
F.; Mendoza-Martínez, G. D.; Plata Perez, F. X.; Martínez-García, J. A.;
Villarreal Espino-Barros, O. A. 2019. Crecimiento de cuyes (Cavia porcellus)
con alimento para conejos y suplementación de vitamina C. Revista MVZ Córdoba.
24(3): 7286-7290. https:// doi.org/10.21897/rmvz.1384
35. Vargas-Romero,
J.; Losada-Custardoy, H.; Cortés-Zorrilla, J.; Alemán-López, V.; Vieyra-Durán,
J.; Luna-Rodríguez, L. 2020. Propuesta gastronómica con Cavia porcellus.
Abanico veterinario. 10: 1-12. http://dx.doi.org/10.21929/abavet2020.31
36. Vela-Román, L.;
Césare-Coral, M.; Norabuena-Meza, E.; Valderrama Rojas, M.; Paitan-Anticona,
E.; Airahuacho-Bautista, F.; Sotelo, A. 2024. Digestibility and estimation of
digestible energy of palm kernel (Elaeis guineensis) cake in guinea pigs
(Cavia porcellus). Livestock Research for Rural Development. 36.
http://www.lrrd.org/lrrd36/2/3612fair.html.
37. Vignale, L. K.
2010. Evaluación de diferentes niveles de energía y proteína cruda en cuyes (Cavia
porcellus) en crecimiento en crianza comercial. MSc. Thesis. Universidad
Nacional Agraria La Molina. https://hdl.handle.net/20.500.12996/1726
38.
Xiccato, G.; Trocino, A. 2020. Energy and protein metabolism and requirements.
In: De Blas, C.; Wiseman. J. (Eds.). The nutrition of the rabbit, 3rd ed. CAB International.
41-57. https:// www.cabi.org/bookshop/book/9781789241273/