Revista de la Facultad de Ciencias Agrarias. Universidad Nacional de Cuyo. En prensa. ISSN (en línea) 1853-8665.
Original article
Optimization of Antioxidant Extraction from Mutisia friesiana, Native Plant of the Quebrada and Puna Regions of Argentina
Optimización de la extracción de antioxidantes de Mutisia friesiana, una planta nativa de las regiones de Quebrada y Puna de Argentina
Norma Beatriz Farfán 2,
Diego Cristos 3,
Gabriela Grigioni 3
1 Consejo Nacional de Investigaciones Científicas y Técnicas (CONICET). Godoy Cruz 2290. C. P. C1425FQB. CABA. Buenos Aires. Argentina.
2 Universidad Nacional de Jujuy. Facultad de Ingeniería. Ítalo Palanca 10. C. P. 4600. San Salvador de Jujuy. Jujuy. Argentina.
3 Instituto de Tecnología de Alimentos. Instituto de Ciencia y Tecnología de Sistemas Alimentarios Sustentables. INTA CONICET. Nicolás Repetto y de los Reseros s/n. C. P. 1686. Hurlingham. Buenos Aires. Argentina.
* danielagodoy@outlook.com
Abstract
The study determined the optimal conditions for extracting antioxidant phenols from Mutisia friesiana (Asteraceae) using ultrasound-assisted extraction. We evaluated extraction time, ethanol concentration, and solid/solvent ratio, applying a Box-Behnken experimental design. Response variables were total phenolic content (TPC), DPPH free radical scavenging activity (EC50), and ferric reducing antioxidant power (FRAP). All extraction variables were optimized by the response surface methodology. The optimal conditions resulted in 15 minutes of extraction, 65% ethanol, and a solid/solvent ratio of 5 g/100 mL. Under these conditions, TPC, EC50, and FRAP values were 54.24 mg GAE/g dw, 31.40 μg/mL, and 965.32 μmol EFe(II)/g dw, respectively. Extract HPLC–MS analysis under optimal conditions identified four phenolic compounds, previously reported for their antioxidant properties. This study provides valuable insights into optimal extraction parameters of bioactive compounds from M. friesiana, positioning the species as a promising natural antioxidants source for the food industry, particularly meat products.
Keywords: Mutisia friesiana, antioxidants, phenolic compounds, ultrasound-assisted extraction, response surface methodology
Resumen
El estudio determinó las condiciones óptimas para la extracción de fenoles antioxidantes de Mutisia friesiana (Asteraceae) mediante extracción asistida por ultrasonido. Se evaluaron el tiempo de extracción, la concentración de etanol y la relación sólido/disolvente, utilizando un diseño experimental Box-Behnken. Las variables de respuesta fueron el contenido fenólico total (TPC), la actividad de eliminación de radicales libres DPPH (EC50) y el poder antioxidante férrico reductor (FRAP). Todas las variables de extracción se optimizaron mediante metodología de superficie de respuesta. Las condiciones óptimas correspondieron a 15 minutos de extracción, etanol al 65% y una relación sólido/disolvente de 5 g/100 mL. Bajo estas condiciones, los valores de TPC, EC50 y FRAP fueron 54,24 mg GAE/g ps, 31,40 μg/mL y 965,32 μmol EFe(II)/g ps, respectivamente. El análisis por HPLC-MS del extracto obtenido en condiciones óptimas identificó cuatro compuestos fenólicos previamente reportados por sus propiedades antioxidantes. Este estudio proporciona información valiosa sobre los parámetros óptimos de extracción de compuestos bioactivos de M. friesiana, posicionando a la especie como una fuente natural prometedora de antioxidantes para la industria alimentaria, en particular para productos cárnicos.
Palabras clave: Mutisia friesiana, antioxidantes, compuestos fenólicos, extracción asistida por ultrasonido, metodología de superficie de respuesta
Originales: Recepción: 04/04/2025 - Aceptación: 23/10/2025
Introduction
The genus Mutisia (Asteraceae, subfamily Mutisioideae, tribe Mutisieae) comprises between 59 and 63 species, found exclusively in South America. Species within this genus are distributed along the Andes, from northern Colombia to southern Argentina (6, 7, 14, 21, 27). Previous studies have investigated several Mutisia species, including M. acuminata, M. orbignyana, M. venusta, M. lanata, M. cochabambensis, and M. ledifolia, collected from Peru, Chile, and Bolivia. Studies on their phytochemical composition identified secondary metabolites such as flavonoids, hydroxycinnamic acids, and chlorogenic acid derivatives (8, 10, 11, 13, 17, 18, 20, 31). In addition, antioxidants (10, 18) and antibacterial activities (9) linked to phenolic compounds have been reported.
Mutisia friesiana is a perennial shrub native to southern Bolivia and northwestern Argentina, growing at 3500-4000 m above sea level. In northern Argentina, especially in the Quebrada and Puna regions, its leaves are used to prepare medicinal infusions consumed to treat respiratory diseases and stomach pains (1, 24, 38). Locally, the plant is known as “romerillo” and is obtained from local markets or through direct collection. Although M. friesiana is well known and widely used, research on this species remains limited. A search in PubMed, Google Scholar, SciELO, and Latindex using the keywords “Mutisia friesiana” retrieved several works by Viturro et al. (1999, 2000, 2001, 2003, 2004, 2005). Viturro et al. (2001, 2003, 2004, 2005) elucidated furanones, methylphenones, 5-methylcoumarins, 5-methylcoumaranones, and a chromone derivative from M. friesiana extracts. Several of these compounds showed antifungal and bactericidal activity. Viturro et al. (2000) identified 127 volatile compounds in its essential oil. Viturro et al. (1999) reported antioxidant activity in methanolic extracts of aerial parts using a DPPH discoloration assay. Additionally, bioassay-guided isolation revealed the presence of caffeic acid derivatives and flavonoids.
Based on this literature review, a clear research gap exists regarding the antioxidant potential of M. friesiana. This gap motivated a detailed investigation into the bioactive properties of its extracts, driven by the current interest in natural antioxidants. Antioxidants from natural sources have gained increasing interest due to their diverse applications. Over the past decade, research has focused on their safety, beneficial properties, and potential use in food and pharmaceutical industries (25, 30). The Quebrada and Puna regions host plant species with largely unexplored antioxidant potential. Studying these native plants supports sustainable resource use and offers economic opportunities for local communities.
This study aimed to optimize ultrasound-assisted extraction (UAE) conditions for antioxidant phenols from M. friesiana. Extraction time, solvent concentration, and solid/ solvent ratio were optimized by response surface methodology (RSM). Finally, phenolic compounds in the optimized extract were identified and quantified using HPLC-MS.
Materials and Methods
Plant Material
The M. friesiana samples were collected in March in Cianzo, Jujuy, Argentina (latitude: -23.1768, longitude: -65.1668, altitude: 3539 m above sea level). A voucher specimen was deposited at the PRONOA-UNJu herbarium (Facultad de Ingeniería, Universidad Nacional de Jujuy), identified as HN° 21-19. The plant material (aerial parts) was oven-dried at 30°C until constant weight and then ground (Peabody PE-MC9100 mill) to a fine powder. The powder was sieved, and a 250-150 μm particle fraction was separated.
Extraction
Samples were extracted by UAE with ethanol as solvent. Each sample and solvent were placed in an Erlenmeyer flask and sonicated in an ultrasound bath (Cole-Parmer 8890 Instrument, USA). Ethanol concentration, solid/solvent ratio, and sonication time were set according to the experimental design. Extraction was performed at 20°C, 80 W power, and 47 kHz frequency. The extracts were filtered to remove plant debris. The filtrate was centrifuged (20 min at 2500 rpm), and the supernatant was filtered using filter paper (Schleicher & Schuell N°0859). Extracts were stored at 4°C and protected from light until analysis.
Total Phenolic Content (TPC)
TPC was determined using the Folin-Ciocalteu method (32) with minor modifications. Each microtube contained 100 μL of extract (0.5-0.0625 mg/mL) and 200 μL of Folin-Ciocalteu reagent (10%). After 3 min, 800 μL of sodium carbonate solution (7.4%) was added, and the mixture was vortexed for 30 seconds. After 60 min in the dark at room temperature, absorbance was measured at 760 nm (Epoch spectrophotometer, BioTeK), against a blank prepared using 100 μL of solvent. The analysis was performed in triplicate. TPC values were expressed as mg gallic acid equivalents per gram of M. friesiana dry weight (mg GAE/g dw), using a gallic acid standard curve.
Antioxidant Activity
DPPH (2,2-diphenyl-1-picrylhydrazyl) free radical scavenging activity was evaluated following Brand-Williams et al. (1995), with slight modifications. Serial dilutions were prepared from each extract. Then, 25 μL of each dilution and 200 μL of methanolic DPPH solution (absorbance 1.0 at 515 nm) were added to microplate wells. The mixture was kept in the dark for 30 min, and absorbance was measured at 515 nm (Microplate Spectrophotometer Epoch, BioTeK). Antioxidant activity was expressed as the Effective Concentration 50 (EC50, μg/mL), which represents the extract concentration required to reduce DPPH absorbance by 50%. The analysis was performed in triplicate.
For FRAP (ferric reducing antioxidant power), the method of Benzie & Strain (1996) was used. Each microtube contained 30 μL of extract, 90 μL of water, and 900 μL of FRAP reagent. After 30 min at 37°C, absorbance was recorded at 595 nm (Microplate Spectrophotometer Epoch, BioTeK). The FRAP reagent was prepared by mixing acetate buffer (pH 3.6), 2,4,6-tripyridyl-s-triazine (10 mM in 40 mM hydrochloric acid), and ferric chloride hexahydrate (20 mM) in a 10:1:1 ratio. The analysis was performed in triplicate. Results were expressed as μmol Fe(II) equivalents per gram of M. friesiana dry weight (μmol EFe(II)/g dw) using a ferrous sulfate heptahydrate standard curve.
Analysis of Phenolic Compounds
Chromatographic analysis was performed on the extract obtained under optimal conditions using ultra-high performance liquid chromatography (UPLC) (Waters Acquity system) with a single quadrupole mass detector. Separation was achieved using an XBridge BEH C18 column (2.5 μm, 2.1x150 mm) maintained at 45°C. Mobile phases were 0.1% acetic acid in water (eluent A) and 0.1% acetic acid in methanol (eluent B), at 0.2 mL/min flow. The injection volume was 10 μL. The gradient was: (95:5)-(95:5) 0-2 min, (95:5)-(80:20) 2-5 min, (80:20)-(20:80) 5-10 min, (20:80)-(0:100) 10-11 min, (0:100)-(0:100) 11-13 min, (0:100)-(95:5) 13-14 min, (95:5) 14-20 min. Quantification was performed in selected ion monitoring mode, under positive ESI ionization. Identification was based on retention time and the abundance of the confirmation ion (C ion) relative to that of the quantification ion (Q ion).
Experimental Design and Statistical Analysis
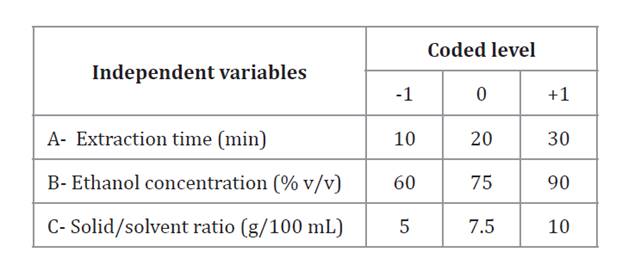
A Box-Behnken design was used in a single block with five central points (Design-Expert 11 software). Table 1 shows independent variables and their levels. Maximum and minimum limits were defined from preliminary trials. The response variables included TPC, DPPH, and FRAP.
Table 1. Independent variables and their coded and uncoded levels.
Tabla 1. Variables independientes y sus niveles codificados y no codificados.
Experimental data were fitted using equation 1, where y represents the predicted response. Regression coefficients (β0, βi, βii, and βij) corresponded to central, linear, quadratic, and interaction terms. n was the number of independent variables, and xi and xj were coded values (-1 to 1). Analysis of variance (ANOVA) was performed at 95% confidence to test model significance and fit.
 (1)
(1)
To optimize extraction, RSM was applied. Validation was performed under the predicted optimal conditions. Experimental and predicted values were compared, and error rates calculated using equation 2. A Pearson correlation analysis was performed between DPPH-TPC and FRAP-TPC responses.
Error rate (%) = 100 * (Experimental value - Predicted value)/Experimental value (2)
Results and Discussion
Fitting Models
Table 2, shows the Box-Behnken experimental design and the values obtained for each response variable.
Table 2. Box-Behnken design for the independent variables and corresponding response values for each extraction.
Tabla 2. Diseño experimental Box-Behnken para las variables independientes y valores de respuesta correspondientes a cada extracción.
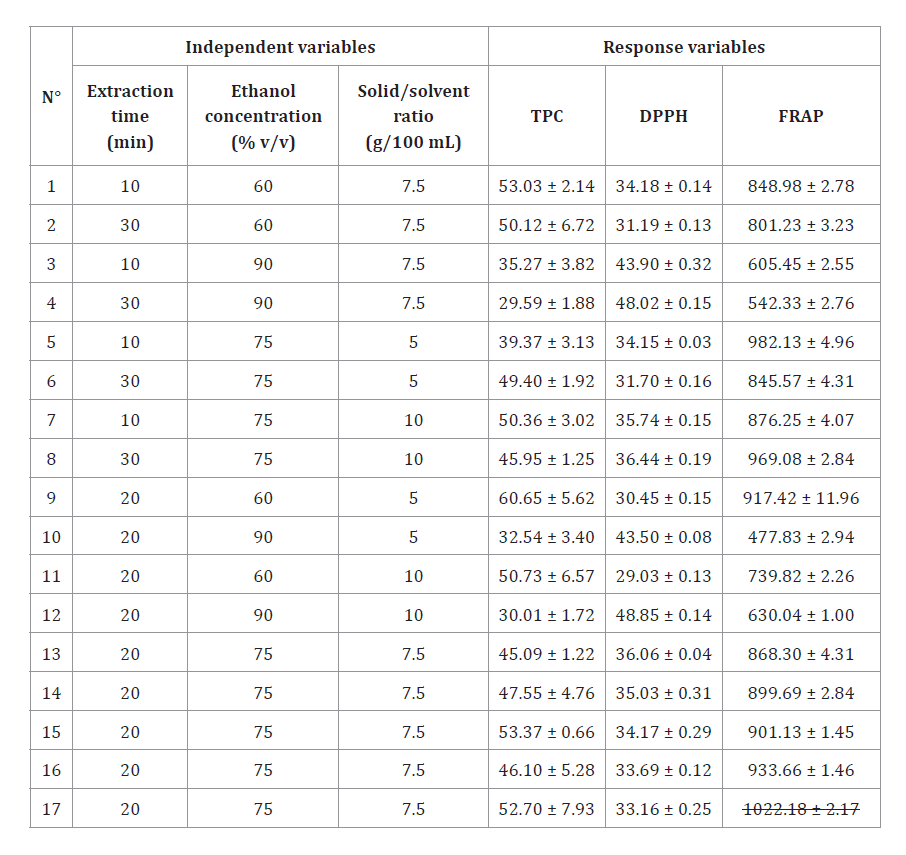
Values are expressed as mean (n=3) ± standard deviation. TPC: total phenolic content (mg GAE/g dw), DPPH: effective concentration 50 (μg/mL), FRAP: ferric reducing antioxidant power (μmol EFe(II)/g dw).
Los valores corresponden a la media (n=3) ± desviación estándar. TPC: contenido fenólico total (mg GAE/g ps), DPPH: concentración efectiva 50 (μg/mL), FRAP: poder antioxidante reductor férrico (μmol EFe(II)/g ps).
The relationship between independent and response variables was fitted using a reduced second-order polynomial model. Non-significant terms (p > 0.05) not involved in significant interactions were excluded. Reduced models for TPC, DPPH, and FRAP are presented in equations 3, 4, and 5, respectively. Regression coefficients correspond to coded independent variables (A: extraction time; B: ethanol concentration; C: solid/solvent ratio).
TPC (mg GAE⁄g dw) = 47.76 - 10.89 B - 5.02 B2 (3)
DPPH (μg⁄mL) = 34.16 - 0.08 A + 7.43 B + 1.28 C + 1.78 A*B + 1.69 B*C + 4.18 B2 (4)
FRAP (μmol EFe(II)/g dw) = 909.48 - 19.32 A - 131.48 B - 0.97 C + 57.35 A*C + 82.45 B*C - 214.09 B2 (5)
Analysis of variance confirmed that all models were significant (p < 0.0001) with non-significant lack of fit (p-values: TPC = 0.4518, DPPH = 0.3260, FRAP = 0.8196). Coefficients R2 (TPC = 0.8147, DPPH = 0.9681, FRAP = 0.9891) and adjusted R2 values (TPC = 0.7883, DPPH = 0.9489, FRAP = 0.9818) indicated a strong fit between experimental and predicted data. Predicted R2 values (TPC=0.7295, DPPH=0.8541, FRAP=0.9678) differed by less than 0.2 from adjusted R2, confirming model reliability (26).
Influence of Independent Variables on TPC
Based on the model (equation 3), the linear and quadratic effects of ethanol concentration (B and B2) significantly influenced TPC. TPC increased as ethanol concentration decreased from 90% to 60%, reaching the highest value at 60% (figures 1a and 1b). In contrast, TPC remained stable despite variations in extraction time and solid/solvent ratio. No significant interaction was observed between these two variables (figure 1c).
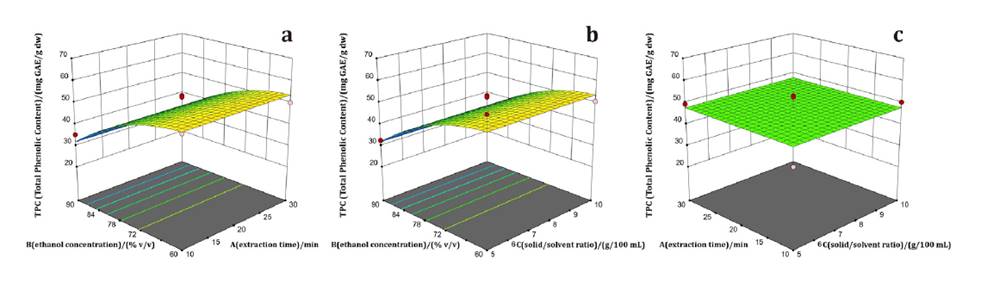
Figure 1. Response surface plots of a) ethanol concentration vs. extraction time, b) ethanol concentration vs. solid/solvent ratio, and c) extraction time vs. solid/solvent ratio on TPC of Mutisia friesiana extracts.
Figura 1. Gráficos de superficie de respuesta de a) concentración de etanol vs. tiempo de extracción, b) concentración de etanol vs. relación sólido/disolvente y c) tiempo de extracción vs. relación sólido/disolvente sobre TPC de los extractos de Mutisia friesiana.
The solvent plays a crucial role in extracting secondary metabolites from plant matrices (4, 15, 36). In this study, a 60% ethanol concentration enhanced the extraction of polar antioxidant phenols. This suggests that phenolic compounds in M. friesiana have a polarity compatible with 60% aqueous ethanol. Aqueous ethanol also promotes plant tissue hydration, facilitates solvent penetration, and improves mass transfer through diffusion (19). Similar findings were reported by Fang et al. (2014) for the UAE of phenolic compounds from Eclipta prostrata (Asteraceae). TPC increased significantly when ethanol concentration rose from 30% to 50% but decreased when ethanol concentration increased from 55% to 80%. A comparable pattern was observed for Achillea kellalensis (Asteraceae), where TPC increased up to 43% ethanol before declining (44). Differences in optimal ethanol concentration may result from variations in plant matrix composition and specific phenolic profiles.
Influence of Independent Variables on Antioxidant Activity
Ethanol concentration (B), solid/solvent ratio (C), and the interactions A*B, B*C, and B2 significantly affected DPPH activity (equation 4). EC50 decreased as ethanol concentration declined from 90 to 60% (figure 2a). At 60% ethanol, an extraction time of 30 min improved free radical scavenging activity by 9% compared to 10 min. Figure 2b, shows greater antioxidant activity at lower ethanol concentrations and solid/solvent ratios. No significant interaction was observed between extraction time (A) and solid/solvent ratio (C) (figure 2c). EC50 is inversely related to antioxidant capacity, meaning lower EC50 values indicate stronger antioxidant activity.
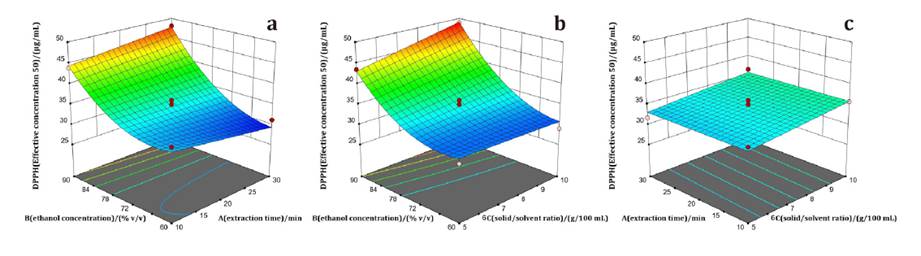
Figure 2. Responses surface plots of a) ethanol concentration vs. extraction time, b) ethanol concentration vs. solid/solvent ratio, and c) extraction time vs. solid/solvent ratio on DPPH of Mutisia friesiana extracts.
Figura 2. Gráficos de superficie de respuesta de a) concentración de etanol vs. tiempo de extracción, b) concentración de etanol vs. relación sólido/disolvente y c) tiempo de extracción vs. relación sólido/disolvente, sobre DPPH de los extractos de Mutisia friesiana.
Extraction time (A), ethanol concentration (B), and the interactions A*C and B*C significantly influenced FRAP (equation 5). FRAP was highest with 60% ethanol and 10 min of extraction (figure 3a), and increased at a solid/solvent ratio of 5 g/100 mL (figure 3b). In contrast, longer extraction times and higher solid/solvent ratios decreased FRAP values (figure 3c).
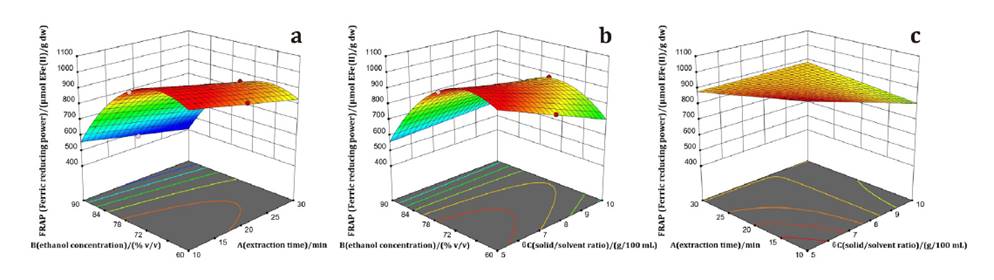
Figure 3. Responses surface plots of a) ethanol concentration vs. extraction time, b) ethanol concentration vs. solid/solvent ratio, and c) extraction time vs. solid/solvent ratio, on FRAP of Mutisia friesiana extracts.
Figura 3. Gráficos de superficie de respuesta de a) concentración de etanol vs. tiempo de extracción, b) concentración de etanol vs. relación sólido/disolvente y c) tiempo de extracción vs. relación sólido/disolvente, sobre FRAP de los extractos de Mutisia friesiana.
The extraction process is based on mass-transfer principles, where concentration gradients between the solid and solvent act as the driving force (37). Reducing the solid/solvent ratio increases this gradient, improving diffusivity and solute dissolution (22). Consequently, the extraction efficiency of antioxidant phenols is enhanced. However, extended extraction times may cause phenolic degradation due to prolonged cavitation (19).
Ethanol concentration was the main factor influencing antioxidant activity. This likely reflects the higher affinity of antioxidant phenols for the polarity of aqueous ethanol. The higher TPC obtained at 60% ethanol agrees with the stronger antioxidant activity of the extract. Sobhani et al. (2022) found similar trends for Echinacea purpurea hydroalcoholic extracts. Antioxidant activity correlated strongly with total phenolic content. Phenolic compounds can transfer electrons and/or hydrogen atoms to neutralize free radicals, thereby exerting antioxidant action (28). Pearson correlation analysis showed a significant correlation (p < 0.001) between antioxidant activity and phenolic content in M. friesiana extracts. Correlation coefficients for DPPH-TPC and FRAP-TPC were -0.89 and 0.83, respectively. Comparable correlations were reported for ethanolic extracts of Sudanese medicinal plants (15) and Andean plant extracts (10).
Optimization
Extraction conditions were optimized to maximize TPC and FRAP and minimize DPPH values. Based on response surface analysis (Design-Expert 11 software), the optimal combination of parameters was 15 min of extraction, 65% ethanol, and a solid/solvent ratio of 5 g/100 mL. Model validation was performed under these predicted optimal conditions. Experimental results agreed with predicted values, with error rates between 1.40 and 3.20% (table 3). These values are consistent with optimization studies of Berberis asiatica methanolic extracts (2) and Centaurea sp. leaves (4). The results confirmed the models accurately described the extraction process and can reliably predict and optimize the extraction of antioxidant phenols from M. friesiana.
Table 3. Experimental and predicted values of response variables under optimal extraction conditions.
Tabla 3. Datos experimentales y valores predichos de las variables de respuesta bajo condiciones de extracción óptimas.
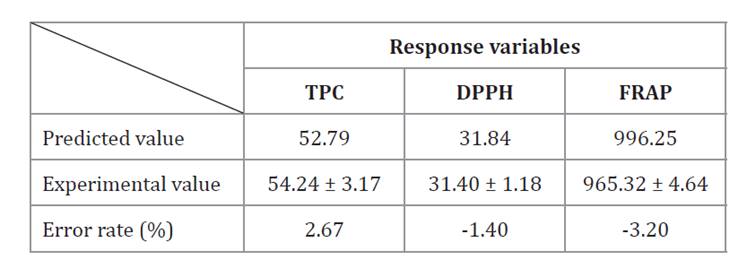
Values are expressed as mean (n=3) ± standard deviation. TPC: total phenolic content (mg GAE/g dw), DPPH: effective concentration 50 (μg/ mL), FRAP: ferric reducing antioxidant power (μmol EFe(II)/g dw).
Los valores corresponden a la media (n=3) ± desviación estándar. TPC: contenido fenólico total (mg GAE/g ps), DPPH: concentración efectiva 50 (μg/mL), FRAP: poder antioxidante reductor férrico (μmol EFe(II)/g ps).
Analysis of Phenolic Compounds in the Optimized Extract
Eleven phenolic compounds were selected for targeted analysis in the optimized extract, as they had been previously reported in species of the same genus (table 4) (8, 17, 38). Four phenolic compounds were identified in the M. friesiana extract (table 4): 3-O-caffeoylquinic acid, 5-O-caffeoylquinic acid, caffeic acid, and arbutin, of which only two were quantified. For comparison, table 4, lists values reported by other authors. Catalano et al. (1995) and Daily et al. (1988) reported higher arbutin contents in M. acuminata extracts than those found in M. friesiana. Similarly, Viturro et al. (1999) and Fernández-Galleguillos et al. (2023) confirmed the presence of 3-O-caffeoylquinic acid, 5-O-caffeoylquinic acid, and caffeic acid in M. friesiana extracts. According to previous studies, 3-O-caffeoylquinic acid, 5-O-caffeoylquinic acid, caffeic acid, and arbutin exhibit high antioxidant activity (12, 34, 35).
Table 4. Phenolic compounds identified in the optimized Mutisia friesiana extract by HPLC-MS analysis.
Tabla 4. Compuestos fenólicos identificados en el extracto optimizado de Mutisia friesiana por HPLC-MS.
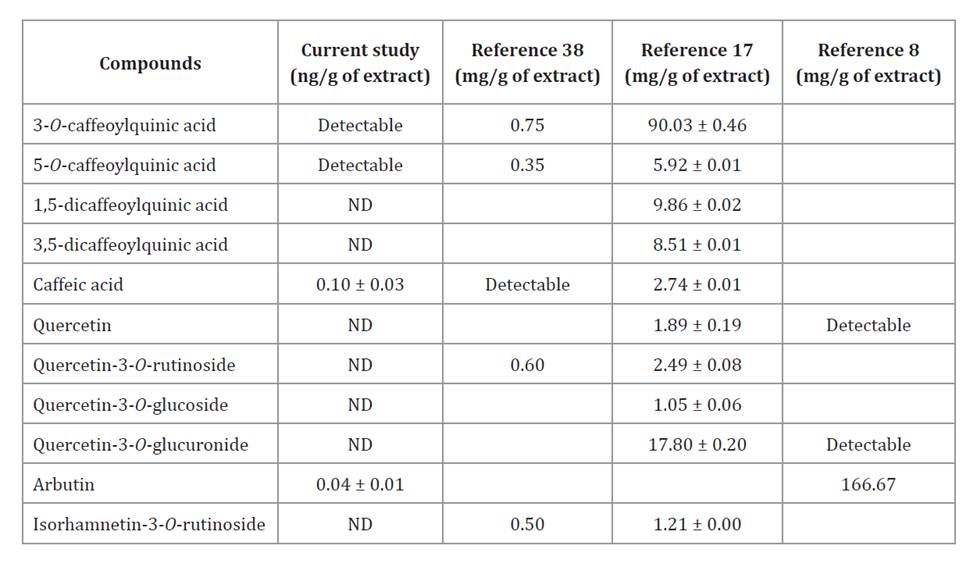
Values are expressed as mean (n=3) ± standard deviation. LC: 0.02 ng/g. ND: not detectable.
Los valores corresponden a la media (n=3) ± desviación estándar. LC: 0.02 ng/g. ND: no detectable.
Total phenolic content in the optimized M. friesiana extract was comparable to the M. acuminata extract (59.4 mg GAE/ g dw) (10). However, the concentration of quantified antioxidant phenols in the M. friesiana extract was lower than previously reported (table 4). Only four of the eleven target compounds were detected. These differences may result from the extraction method and the solvent used, which directly influence extract composition. Palmieri et al. (2020) reported variations in the chemical profiles of Cannabis sativa, Thymus vulgaris, and Coriandrum sativum depending on the extraction method. Likewise, Llorent-Martínez et al. (2020) observed compositional changes in Cirsium yildizianum extracts when modifying the extraction solvent and technique. Therefore, the M. friesiana extract obtained in this study may contain additional antioxidant phenols beyond those previously reported. Further chemical characterization should fully define its phenolic profile.
Conclusions
An extract with antioxidant activity was successfully obtained from M. friesiana. Ultrasound-assisted extraction parameters (extraction time, ethanol concentration, and solid/solvent ratio) were optimized to enhance the recovery of antioxidant phenols. The highest phenolic yield and antioxidant activity were achieved using 15 minutes of extraction, 65% ethanol, and a solid/solvent ratio of 5 g/100 mL. Under these conditions, total phenolic content reached 54.24 mg GAE/g dw, and antioxidant activity values were 31.40 μg/mL (DPPH) and 965.32 μmol EFe(II)/g dw (FRAP). HPLC-MS analysis identified four phenolic compounds, all previously reported for their antioxidant properties. These findings highlight the potential of M. friesiana as a promising natural source of antioxidants. The extract may have multiple applications in the food industry, particularly to prevent oxidative damage during storage. However, further studies are needed to assess its safety, stability, and functional effectiveness. Research on this native species could also benefit local communities by promoting the sustainable use of traditional plant resources. Moreover, the development and commercialization of products derived from M. friesiana could support local economies in northern Argentina.
1. Barboza, G. E.; Cantero, J. J.; Núñez, C.; Pacciaroni, A.; Ariza Espinar, L. 2009. Medicinal plants: A general review and a phytochemical and ethnopharmacological screening of the native Argentine Flora. Kurtziana. 34(1-2): 7-365.
2. Belwal, T.; Dhyani, P.; Bhatt, I. D.; Rawal, R. S.; Pande, V. 2016. Optimization extraction conditions for improving phenolic content and antioxidant activity in Berberis asiatica fruits using response surface methodology (RSM). Food Chemistry. 207: 115-124. https://doi. org/10.1016/j.foodchem.2016.03.081
3. Benzie, I. F.; Strain, J. J. 1996. The ferric reducing ability of plasma (FRAP) as a measure of antioxidant power: the FRAP assay. Analytical Biochemistry. 239(1): 70-76. https://doi.org/10.1006/ abio.1996.0292
4. Bouafia, M.; Colak, N.; Ayaz, F. A.; Benarfa, A.; Harrat, M.; Gourine, N.; Yousfi, M. 2021. The optimization of ultrasonic-assisted extraction of Centaurea sp. antioxidative phenolic compounds using response surface methodology. Journal of Applied Research on Medicinal and Aromatic Plants. 25:100330. https://doi.org/10.1016/j.jarmap.2021.100330
5. Brand-Williams, W.; Cuvelier, M. E.; Berset, C. L. W. T. 1995. Use of a free radical method to evaluate antioxidant activity. LWT-Food Science and Technology. 28(1): 25-30. https://doi. org/10.1016/S0023-6438(95)80008-5
6. Bremer, K. 1994. Asteraceae. Cladistics and classification. Timber Press.
7. Cabrera, A. L. 1965. Revisión del género Mutisia (Compositae). Opera Lilloana 13. San Miguel de Tucumán. Fundación Miguel Lillo.
8. Catalano, S.; Cioni, P. L.; Flamini, G.; De Feo, V.; Morelli, I. 1995. Chemical investigation of the aerial parts of Mutisia acuminata. International Journal of Pharmacognosy. 33(1): 73-74. https:// doi.org/10.3109/13880209509088152
9. Catalano, S.; Cioni, P. L.; Panizzi, L.; Morelli, I. 1998. Antimicrobial activity of extracts of Mutisia acuminata var. acuminata. Journal of Ethnopharmacology. 59(3): 207-209. https://doi. org/10.1016/S0378-8741(97)00113-X
10. Chirinos, R.; Pedreschi, R.; Rogez, H.; Larondelle, Y.; Campos, D. 2013. Phenolic compound contents and antioxidant activity in plants with nutritional and/or medicinal properties from the Peruvian Andean region. Industrial Crops and Products. 47: 145-152. https://doi. org/10.1016/j.indcrop.2013.02.025
11. Chui Tinco, G. 2021. Estudio fitoquímico preliminar de cinco especies vegetales del altiplano sur y determinación de componentes mayoritarios de la especie vegetal Lampaya castellani Moldenke. Tesis de grado en Licenciatura en Ciencias Químicas. Facultad de Ciencias Puras y Naturales. Universidad Mayor de San Andrés. La Paz. Bolivia.
12. Cizmarova, B.; Hubkova, B.; Bolerazska, B.; Marekova, M.; Birkova, A. 2020. Caffeic acid: A brief overview of its presence, metabolism, and bioactivity. Bioactive Compounds in Health and Disease. 3(4): 74-81. https://doi.org/10.31989/bchd.v3i4.692
13. Daily, A.; Seligmann, O.; Nonnenmacher, G.; Fessler, B.; Wong, S. M.; Wagner, H. 1988. New chromone, coumarin, and coumestan derivatives from Mutisia acuminata var. hirsuta. Planta Medica. 54(1): 50-52. https://doi.org/10.1055/s-2006-962334
14. Del Vitto, L. A.; Petenatti, E. M. 2009. Asteráceas de importancia económica y ambiental: Primera parte. Sinopsis morfológica y taxonómica, importancia ecológica y plantas de interés industrial. Multequina. 18(2): 87-115.
15. Dirar, A. I.; Alsaadi, D. H. M.; Wada, M.; Mohamed, M. A.; Watanabe, T.; Devkota, H. P. 2019. Effects of extraction solvents on total phenolic and flavonoid contents and biological activities of extracts from Sudanese medicinal plants. South African Journal of Botany. 120: 261-267. https://doi.org/10.1016/j.sajb.2018.07.003
16. Fang, X.; Wang, J.; Wang, Y.; Li, X.; Zhou, H.; Zhu, L. 2014 Optimization of ultrasonic-assisted extraction of wedelolactone and antioxidant polyphenols from Eclipta prostrate L using response surface methodology. Separation and Purification Technology. 138: 55-64. https://doi.org/10.1016/j.seppur.2014.10.007
17. Fernández-Galleguillos, C.; Jiménez-Aspee, F.; Mieres-Castro, D.; Rodríguez-Núñez, Y. A.; Gutiérrez, M.; Guzmán, L.; Echeverría, J.; Sandoval-Yañez, C.; Forero-Doria, O. 2023. Phenolic Profile and Cholinesterase Inhibitory Properties of Three Chilean Altiplano Plants: Clinopodium gilliesii (Benth.) Kuntze [Lamiaceae], Mutisia acuminata Ruiz & Pav. var. hirsuta (Meyen) Cabrera, and Tagetes multiflora (Kunth) [Asteraceae]. Plants. 12(4): 819. https://doi.org/10.3390/plants12040819
18. Flores, Y.; Rodrigo, G.; Mollinedo, P.; Akesson, B.; Sterner, O.; Almanza, G. R. 2009. A 5-methylcoumarin glucoside and a coumestan derivative from Mutisia orbignyana. Revista Boliviana Química. 26(1): 21-26.
19. Ghitescu, R. E.; Volf, I.; Carausu, C.; Bühlmann, A. M.; Gilca, I. A.; Popa, V. I. 2015. Optimization of ultrasound-assisted extraction of polyphenols from spruce wood bark. Ultrasonics Sonochemistry. 22: 535-541. https://doi.org/10.1016/j.ultsonch.2014.07.013
20. Juárez, B. E.; Mendiondo, M. E. 2003. Flavonoids from Mutisia acuminata. Pharmaceutical Biology. 41(4): 291-292. https://doi.org/10.1076/phbi.41.4.291.15669
21. Katinas, L.; Pruski, J.; Sancho, G.; Tellería, M. C. 2008. The subfamily Mutisioideae (Asteraceae). The Botanical Review. 74(4): 469-716. https://doi.org/10.1007/s12229-008-9016-6
22. Kumar, K.; Srivastav, S.; Sharanagat, V. S. 2021. Ultrasound assisted extraction (UAE) of bioactive compounds from fruit and vegetable processing by-products: A review. Ultrasonics Sonochemistry. 70:105325. https://doi.org/10.1016/j.ultsonch.2020.105325
23. Llorent-Martínez, E. J.; Zengin, G.; Sinan, K. I.; Polat, R.; Canlı, D.; Picot-Allain, M. C. N.; Mahomoodally, M. F. 2020. Impact of different extraction solvents and techniques on the biological activities of Cirsium yildizianum (Asteraceae: Cynareae). Industrial Crops and Products. 144:112033. https://doi.org/10.1016/j.indcrop.2019.112033
24. Lopez, V. L.; Cellini, J. M. 2022. Plantas medicinales asociadas a bosques de Polylepis tarapacana del altiplano jujeño: Riqueza y cobertura en gradientes geográficos, topográficos y de estructura forestal. Ecología Austral. 32(3): 894-907. https://doi.org/10.25260/ EA.22.32.3.0.1905
25. Lourenço, S. C.; Moldão-Martins, M.; Alves, V. D. 2019. Antioxidants of natural plant origins: From sources to food industry applications. Molecules. 24(22): 4132. https://doi.org/10.3390/ molecules24224132
26. Montgomery, D. C. 2004. 2° ed. Métodos de superficies de respuesta y otros enfoques para la optimización de procesos. In John Wiley & Sons (Ed.). Diseño y análisis de experimentos. Limusa. 427-510.
27. Moreira-Muñoz, A.; Scherson, R. A.; Luebert, F.; Román, M. J.; Monge, M.; Diazgranados, M.; Silva, H. 2020. Biogeography, phylogenetic relationships and morphological analyses of the South American genus Mutisia Lf (Asteraceae) shows early connections of two disjunct biodiversity hotspots. Organisms Diversity & Evolution. 20: 639-656. https://doi. org/10.1007/s13127-020-00454-z
28. Olszowy, M. 2019. What is responsible for antioxidant properties of polyphenolic compounds from plants? Plant Physiology and Biochemistry. 144: 135-143. https://doi.org/10.1016/j. plaphy.2019.09.039
29. Palmieri, S.; Pellegrini, M.; Ricci, A.; Compagnone, D.; Lo Sterzo, C. 2020. Chemical composition and antioxidant activity of thyme, hemp and coriander extracts: A comparison study of maceration, Soxhlet, UAE and RSLDE techniques. Foods. 9(9): 1221. https://doi. org/10.3390/foods9091221
30. Pham, D. C.; Nguyen, H. C.; Nguyen, T. H. L.; Ho, H. L.; Trinh, T. K.; Riyaphan, J.; Weng, C. F. 2020. Optimization of ultrasound‐assisted extraction of flavonoids from Celastrus hindsii leaves using response surface methodology and evaluation of their antioxidant and antitumor activities. BioMed Research International. 2020(1): 3497107. https://doi. org/10.1155/2020/3497107
31. Pillco Paulo, D. 2023. Perfil de componentes fenólicos mediante cromatografía líquida y espectrometría de masas de alta resolución en tándem, MS/MS, de cinco especies del género Mutisia. Tesis de grado en Química. Facultad de Ciencias Químicas, Físicas y Matemáticas. Universidad Nacional de San Antonio Abad del Cusco. http:// hdl.handle. net/20.500.12918/7286
32. Singleton, V. L.; Rossi, J. A. 1965. Colorimetry of total phenolics with phosphomolybdic-phosphotungstic acid reagents. American Journal of Enology and Viticulture. 16(3): 144-158. https://doi. org/10.5344/ajev.1965.16.3.144
33. Sobhani, A.; Noormohammadi, N.; Moradi, K.; Ebrahimi, M.; Khanahmadi, M. 2022. Optimization of heat and ultrasound assisted extraction of bioactive compounds from Echinacea purpurea using response surface methodology. Journal of Applied Research on Medicinal and Aromatic Plants. 31:100399. https://doi.org/10.1016/j.jarmap.2022.100399
34. Sova, M. 2012. Antioxidant and antimicrobial activities of cinnamic acid derivatives. Mini-Reviews in Medicinal Chemistry. 12(8): 749-767. https://doi.org/10.2174/138955712801264792
35. Sova, M.; Saso, L. 2020. Natural sources, pharmacokinetics, biological activities and health benefits of hydroxycinnamic acids and their metabolites. Nutrients. 12(8): 2190. https://doi. org/10.3390/nu12082190
36. Tirado-Kulieva, V. A.; Oblitas, J.; León-Roque, N.; Castro, W. (en prensa). Physicochemical Properties, Bioactive Compounds, and Antioxidant Activity of Andean Fruits: Optimization of Extraction by Response Surface Methodology. Revista de la Facultad de Ciencias Agrarias. Universidad Nacional de Cuyo. Mendoza. Argentina. XX(X): XXX-XXX.
37. Villamil-Galindo, E.; Piagentini, A. 2024. Green solvents for the recovery of phenolic compounds from strawberry (Fragaria x ananassa Duch) and apple (Malus domestica) agro-industrial bio-wastes. Revista de la Facultad de Ciencias Agrarias. Universidad Nacional de Cuyo. Mendoza. Argentina. 56(1): 149-160. DOI: https://doi.org/10.48162/rev.39.131
38. Viturro, C. I.; Molina, A.; Schmeda‐Hirschmann, G. 1999. Free radical scavengers from Mutisia friesiana (Asteraceae) and Sanicula graveolens (Apiaceae). Phytotherapy Research. 13(5): 422-424. https://doi.org/10.1002/(SICI)1099-1573(199908/09)13:5%3C422::AID-PTR462%3E3.0.CO;2-M
39. Viturro, C. I.; de la Fuente, J. 2000. Chemical study of the essential oil of Mutisia friesiana. Molecules. 5(3): 568-570. https://doi.org/10.3390/50300568
40. Viturro, C. I.; Maier, M. S.; Stortz, C. A.; de la Fuente, J. R. 2001. Antifungal diastereomeric furanones from Mutisia friesiana: structural determination and conformational analysis. Tetrahedron: Asymmetry. 12(7): 991-998. https://doi.org/10.1016/S0957-4166(01)00163-X
41. Viturro, C. I.; de la Fuente, J. R.; Maier, M. S. 2003. Antifungal methylphenone derivatives and 5-methylcoumarins from Mutisia friesiana. Zeitschrift für Naturforschung C. 58(7-8): 533-540. https://doi.org/10.1515/znc-2003-7-815
42. Viturro, C. I.; de la Fuente, J. R.; Maier, M. S. 2004. 5-Methylcoumaranones from Mutisia friesiana and their bioactivity. Journal of Natural Products. 67(5): 778-782. https://doi.org/10.1021/ np0304058
43. Viturro, C. I.; de la Fuente, J. R.; Maier, M. S. 2005. One new prenylated furanone and other non-polar constituents from Mutisia friesiana. Zeitschrift für Naturforschung B. 60(5): 585-589. https://doi.org/10.1515/znb-2005-0519
44. Yancheshmeh, B. S.; Panahi, Y.; Allahdad, Z.; Abdolshahi, A.; Zamani, Z. 2022. Optimization of ultrasound-assisted extraction of bioactive compounds from Achillea kellalensis using response surface methodology. Journal of Applied Research on Medicinal and Aromatic Plants. 28:100355. https://doi.org/10.1016/j.jarmap.2021.100355