Revista de la Facultad de Ciencias
Agrarias. Universidad Nacional de Cuyo. En prensa. ISSN (en línea) 1853-8665.
Original article
Social
Welfare Effects of Water Security Improvements in Arid Regions: The Case of
Mendoza, Argentina
Efectos
sobre el bienestar social de mejoras en la seguridad hídrica en regiones
áridas: el caso de Mendoza, Argentina
Verónica Inés Farreras González1, 2*,
Carolina Lauro1,
Laura Abraham3,
Pablo Federico Salvador2
1Instituto Argentino de Nivología, Glaciología y Ciencias
Ambientales (CCT-CONICET-Mendoza). Av. Ruiz Leal s/n. Parque General San
Martín. 5500 Mendoza. Argentina.
2Universidad Nacional de Cuyo. Facultad de Ciencias Económicas.
M5502JMA. Mendoza. Argentina.
3Universidad
Nacional de Cuyo. Facultad de Ciencias Agrarias. Cátedra de Administración
Rural. Almirante Brown 500. M5528AHB. Chacras de Coria. Mendoza. Argentina.
*vfarreras@mendoza-conicet.gob.ar
Abstract
Water security is a
critical challenge in Mendoza, Argentina, an arid region that faces rising
water demand and uncertainty caused by climate change. Agriculture consumes 90%
of the fresh water in the region, while vineyards occupy just over 60% of the
cultivated area. This study estimates the social welfare effects of an
improvement in water security achieved by reallocating water from vineyards to
other uses. We used a multidisciplinary approach, applying benefit transfer to
estimate social welfare changes and water footprint to quantify shifts in water
availability. Our findings suggest that a water security policy in the
Mendocinian Northern Oasis can result in an average 21-percentage-point
increase in annual water availability for other uses. This equals an average
household welfare gain of 17.43 US dollars per year (95% CI: 8.40-35.64) at
2024 prices over the next 30 years. This study offers a framework for regions
worldwide facing similar challenges of water scarcity, increasing water demand,
and climate change. Moreover, it can support the design of more informed water
management strategies to ensure long-term water security.
Keywords: water security,
social welfare, benefit transfer method, water footprint, water reallocation,
arid regions, mendocinian northern oasis
Resumen
La seguridad
hídrica es un desafío crítico en Mendoza, Argentina, una región árida que
enfrenta una creciente demanda de agua y la incertidumbre generada por el
cambio climático. La agricultura consume el 90% del agua dulce mientras que los
viñedos ocupan más del 60% de la superficie cultivada. Este estudio estima los
efectos sobre el bienestar social de una mejora en la seguridad hídrica
mediante la reasignación de agua de viñedos a otros usos. Aplicamos un enfoque
multidisciplinario, usando transferencia de beneficios para estimar cambios en
el bienestar social y la huella hídrica para cuantificar variaciones en la
disponibilidad de agua. Nuestros resultados sugieren que una política de
seguridad hídrica en el Oasis Norte Mendocino puede generar un aumento promedio
de 21 puntos porcentuales en la disponibilidad anual de agua para otros usos,
lo que equivale a una ganancia anual promedio en bienestar de 17,43 USD por
hogar (IC 95%: 8,40-35,64), a precios de 2024, durante los próximos 30 años.
Este estudio ofrece un marco replicable en otras regiones con desafíos
similares de escasez y creciente demanda hídrica, contribuyendo al diseño de
estrategias de gestión del agua más informadas para garantizar la seguridad
hídrica a largo plazo.
Palabras claves: seguridad hídrica,
bienestar social, método de la transferencia de beneficios, huella hídrica,
reasignación del agua, regiones áridas, oasis norte de Mendoza
Originales: Recepción: 03/06/2025-
Aceptación: 26/09/2025
Introduction
On the eastern side
of the Central Andes, mountain rivers flow through the Mendocinian landscapes,
providing vital water resources to the region. As population and urban growth
accelerate in an area where water demand is increasing, climate change is
introducing greater uncertainty and variability in water availability (Lauro et al., 2022). If climate models prove
accurate and current water management policies remain unchanged, Mendoza -a
historically arid region- may become even drier in coming decades (Rivera et al., 2020). This scenario could
exacerbate existing water scarcity, intensifying current challenges and
threatening human welfare.
Currently,
agriculture consumes approximately 90% of the fresh water in Mendoza (Duek, 2018). In this context, ensuring secure, sustainable
and profitable food production while conserving water for alternative uses,
including environmental preservation, requires improvements in agricultural
water management efficiency (Pérez Blanco et al.,
2020).
In response, recent
efforts in Mendoza have focused on aligning water distribution with crop water
requirements to improve water management efficiency (Villodas
et al., 2023). However, previous studies, such as that of Morábito et al. (2005), had already addressed
key aspects of this issue. Such efforts could enhance water security by
conserving agricultural water to reallocate to other uses, potentially
improving social welfare. However, the implications of these strategies for
Mendocinian citizens’ welfare remain unclear.
Understanding the
social welfare effects of water security management can provide crucial
insights. For instance, if society were to intervene to enhance water security,
what would be the maximum it would invest in water systems matching crop
requirements? Alternatively, what economic compensation might society consider
offering if the reforms necessary to achieve water security result in
unintended consequences for certain users? Addressing these questions
highlights the importance of economic valuation in public policy decisions.
Economic valuation
is widely applied to estimate the monetary value of changes in people’s welfare
resulting from ecological or environmental shifts (Carson
et al., 1993). However, to our knowledge, this approach has not been
applied to assess how changes in water security -through increased water
availability and reallocation- affect welfare. The closest studies have
addressed the economic valuation of certain aspects of water security, the role
of prices in managing water scarcity, and governance issues (Farreras et al., 2017; Farreras and Abraham, 2020;
Katz, 2016; Pellegrini et al., 2023; Pérez Blanco et al., 2020
and Zetland, 2021). Other related studies examine overexploitation, demand
quantification for various uses, and the impacts of climate variability on
water supply (Castex et al., 2015; Konapala et
al., 2020; Lauro et al., 2021; Rivera et al., 2021).
Motivated by the
importance of economic valuation in decision-making, our study combines
economic and hydrological data from 2010 to 2020 in a case study. Our main aim
is to estimate the changes in citizens’ welfare in the Mendocinian Northern
Oasis due to improved water security. This improvement comes from reallocating
water from vineyards -which cover just over 60% of the cultivated area- to
industry, municipal areas, and non-viticultural crops. These changes are
achieved while maintaining or even increasing grapevine production. The
percentage of water allocated for the population is not included within the
percentage of water available to other uses. This is because Mendoza Water Law
1884, which remains in effect, prioritises water supply for the population over
other uses (DGI, 2016b).
This study provides
a framework for regions worldwide facing similar water scarcity challenges. By
assessing social welfare effects of an improvement in water security, it offers
critical insights for decision-makers, policymakers, and resource managers in
comparable global contexts. These insights support the design of more informed
water management strategies, ensuring long-term water security.
Materials
and Methods
Study
Area
Because of the
region’s dry climate, most agricultural and urban areas in Mendoza are confined
to small parts of the territory. These oases were established using an
irrigation system of ditches and canals that carefully follows the topography
of the region. This system makes the most of the water coming from mountain
rivers, whose streamflow is the result of melting snow and Andean glaciers. It
is also supported by groundwater boreholes (Monnet et
al., 2022; Morábito et al., 2007). In Mendoza, the irrigation
water is managed as a common resource through political and collective
processes. Therefore, long-term water security depends on strong institutions
and deep reforms (Zetland, 2021).
Between 2010 and
2020, mountain rivers in Mendoza experienced a significant hydrological deficit
due to reduced snowfall associated with climate variability and climate change
(Rivera et al., 2021). Under different global
warming scenarios, climate projections for components of the hydrological cycle
in the Central Andes indicate further reductions in snowfall and river flows.
These effects will undoubtedly impact the availability of water resources,
highlighting the need for efficient water use (Castex et
al., 2015; Rivera et al., 2020).
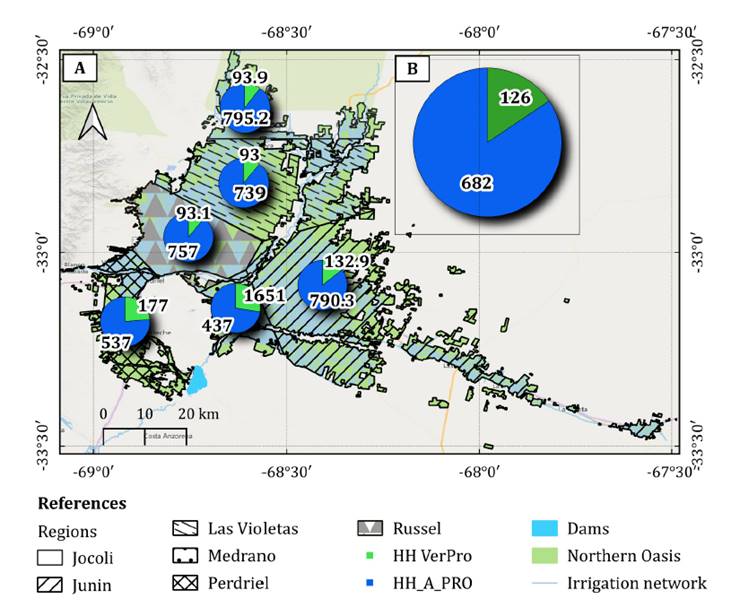
Our area of study,
the Mendocinian Northern Oasis irrigated by the Mendoza and Tunuyán Inferior
Rivers, is home to more than half of the province’s total population (figure 1). This region is characterised by an arid and semi-arid
climate. The average annual minimum and maximum temperatures are 11°C and 23°C,
respectively, with an annual rainfall of 267 mm (SMN,
2024). The soils are classified as typical Torrifluvents with a loamy
texture (INTA, 1990).
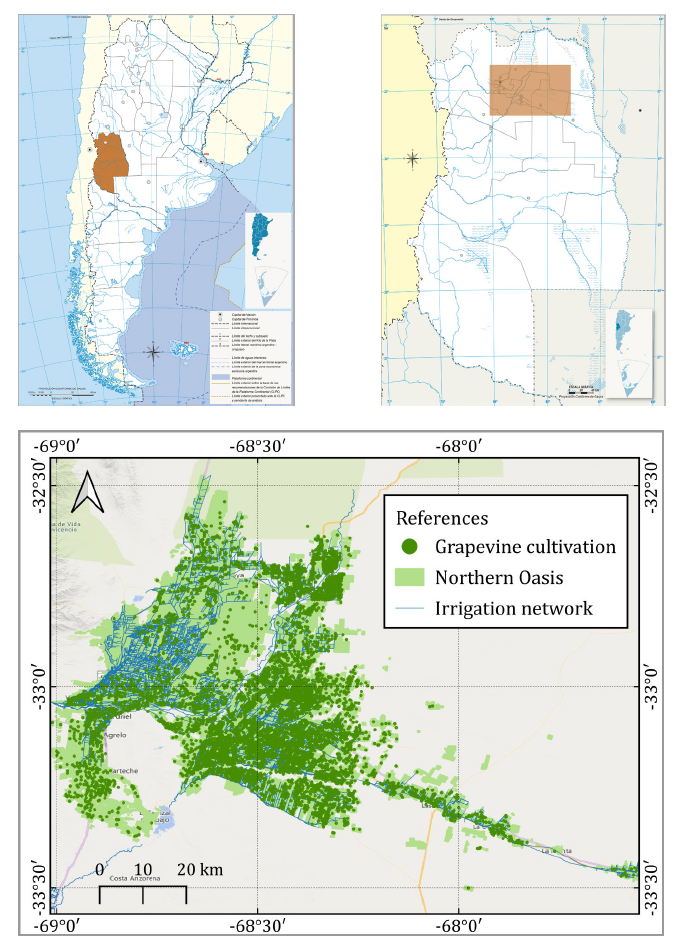
Source:
Own elaboration based on data from the National Sanitary Registry of
Agricultural Products (RENSPA), the Territorial Environmental Information
System (SIAT), and the National Geographic Institute (IGN).
Fuente:
Elaboración propia basada en datos del Registro Nacional Sanitario de
Productores Agropecuarios (RENSPA), el Sistema de Información Ambiental
Territorial (SIAT) y el Instituto Geográfico Nacional (IGN).
Figure
1. Farm units with grapevine cultivation in the
Mendocinian Northern Oasis.
Figura
1. Explotaciones agropecuarias con
cultivo de vid en el Oasis Norte de Mendoza.
Although
agricultural landscapes exhibit considerable crop diversity, grapevine crops -Vitis
vinifera- are predominant, covering just over 60% of the cultivated area (INDEC, 2018). Among the diverse grape varieties grown,
three dominate nearly 50% of the vineyards: Malbec (22.36%), Bonarda (11.75%),
and Cereza (11.50%). The average annual grape production between 2008 and 2017
was approximately 1.1 million tonnes (INV, 2020).
Given the extensive area of vineyards in the oasis, the
efficient use of water is crucial. However, around 75% of grape-growing farms
rely on surface irrigation systems, one of the least water-efficient methods
compared to pressurised systems (INDEC, 2018).
Furthermore, the water distribution system disregards crop-specific
requirements, delivering the same amount of water per hectare regardless of
actual needs. Consequently, regional challenges related to water scarcity are
further exacerbated by current management, increasing uncertainty in the
availability at the oasis level and hindering efficient allocation. This
underscores the need for sustainable and efficient water management to ensure
long-term water security.
In this study, we adopted a multidisciplinary approach. The
benefit transfer method (BTM), widely used in the field of economics, was
applied to extrapolate values obtained from a previous study site to a policy
site. These values were used to predict welfare changes in the Mendocinian Northern
Oasis under water security policies that would reallocate agricultural water to
other uses. Additionally, a hydrological approach -specifically, the water
footprint (WF) methodology proposed by Hoekstra et
al. (2011)- was employed to estimate changes in water availability for
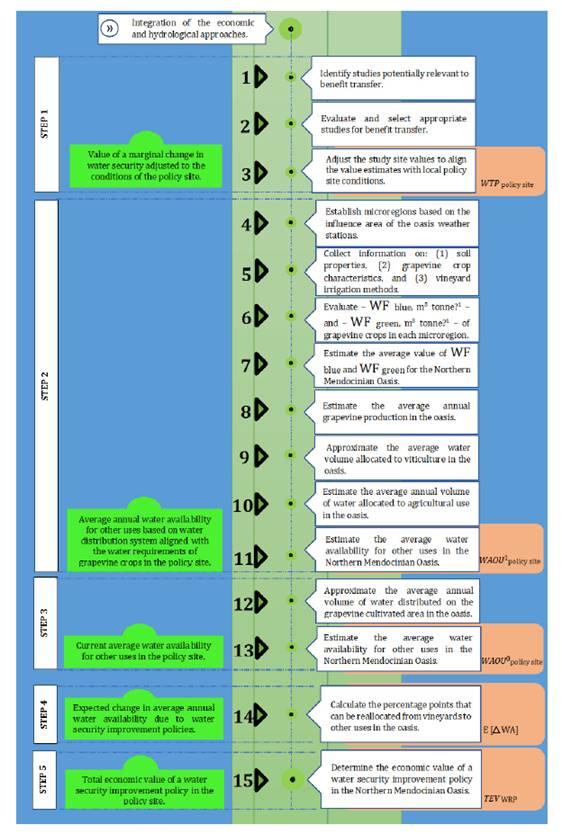
these alternative uses. This integrated approach, used to estimate the total
economic value (TEV) of a water security improvement policy, is summarised
below and illustrated in figure 2.
Source:
Own elaboration.
Fuente:
Elaboración propia.
Figure
2. Methodological framework integrating economic and
hydrological approaches to estimate the TEV of a water security improvement
policy.
Figura
2. Esquema metodológico que combina
enfoques económico e hidrológico para estimar el valor económico total de una
política de mejora de la seguridad hídrica.
First,
we identified potential study sites to infer the change in citizens’ welfare in
the Mendocinian Northern Oasis resulting from a water security improvement
policy. Since welfare is assumed to derive from the preferences satisfaction,
it can be quantified using the willingness to pay (WTP). To enhance welfare
change prediction accuracy, we adjusted the estimated WTP at the study site to
align with the policy site conditions. The process is formally outlined as
follows:
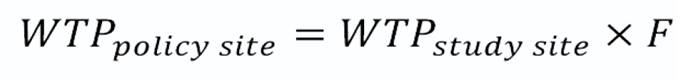
Where WPTpolicy site represents the value
of a marginal change in water security -achieved through a policy that
conserves agricultural water for reallocation to other uses- adjusted to the
policy site’s conditions. WPTstudy
site refers
to the value of a water security change estimated in one or more previous
studies, which requires adjustment. F, the adjustment factor, accounts for
these differences.
Factor 𝐹 may represent different types of adjustments, depending on the similarity between the study and the policy sites. The degree of similarity
is crucial in determining both the extent and the nature of these adjustments (Boutwell and Westra, 2013; Johnston et al., 2021).
Second, we
calculated the average annual water availability for other uses (WAOU 1study
site). This calculation was based on the water
distribution system aligned with the water requirements of grapevine crops in
the Mendocinian Northern Oasis. To achieve this, we first estimated the WF of
grapevine crops and determined the required volume of water according to their
specific needs. The steps involved in this estimation are outlined below.
Initially, specific
data on rainfall, minimum and maximum temperatures, and relative humidity were
collected from six weather stations in the Mendocinian Northern Oasis
(2010-2020). Then, we used these data to divide the oasis into six climatic
microregions based on each station’s influence area. As a result, each
microregion retains the name of its corresponding weather station.
The WF is an
environmental indicator that accounts for the average volume of water required
according to the water needs of crops, expressed per unit of product, i.e.,
volume per unit of mass (m3 tonne-1).
The WF is
calculated as the ratio between the volume of crop water use (CWU, m3
ha-1)
throughout the entire crop growth period -from sprouting to harvest- and crop
yield (Y, tonne ha-1).
The CWU is the volume of water required to compensate for a crop’s
evapotranspiration losses and to prevent crop water stress. This CWU can be
divided into two components: the blue CWU -irrigation water- and the green CWU-
effective rain.
For this research,
we estimated the blue CWU (CWUblue,
m3 ha-1)
and the green CWU (CWUgreen,
m3 ha-1)
for each of the six microregions. The green and blue CWU were calculated from
the accumulation of daily evapotranspiration (ET, mm day-1)
during the growing period, from sprouting to harvest. To perform these
estimations, we used the CROPWAT program (FAO, 2024).
For this, we incorporated meteorological data (table 1),
grapevine crop parameters (Allen et al., 1998;
Civit et al., 2018; Rodriguez et al., 2000), and sandy loam
soil properties estimated with the Soil Water Characteristics software (USDA, 2024).
Table 1. Location
of weather stations and average meteorological data (2010-2020).
Tabla
1. Ubicación de las estaciones
meteorológicas y datos promedio (2010-2020).
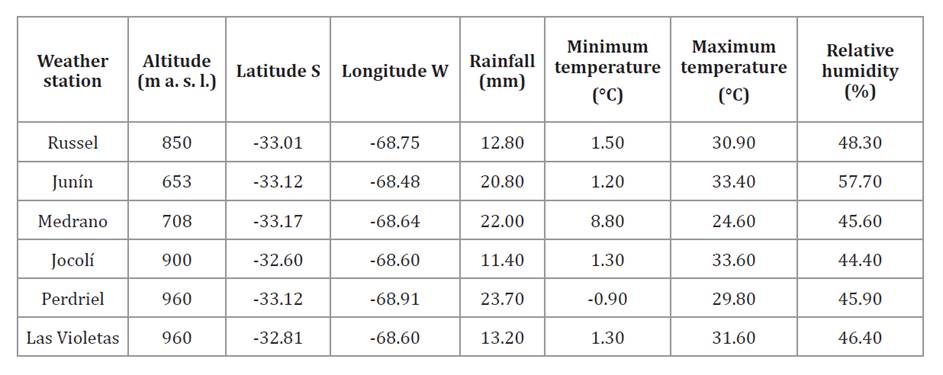
Source:
Own elaboration based on data from the Agriculture and Climate Contingencies
Agency (DACC, 2021) of Mendoza province.
Fuente:
Elaboración propia basada en datos de la Dirección de Agricultura y
Contingencias Climáticas (DACC,
2021) de la provincia de Mendoza.
Using
the blue and green CWU values for each of the six microregions, the specific
blue and green WF of vineyards at the microregion level was inferred separately
from Equations (2) and (3), respectively.
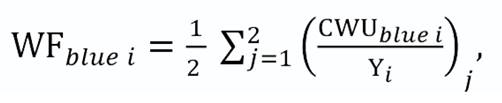
Where WFblue i represents the average
blue WF in the i-th microregion, taking into account both surface and
pressurised irrigation systems; CWUblue i is the blue
CWU in the i-th microregion; Yi is the yield per hectare in the i-th microregion;
and j is the irrigation method, ranging from 1 to 2 (specifying, j = 1
surface and j =2 pressurised irrigation systems). The distinction in the
irrigation systems was considered using various crop coefficients (Kc) to
account for the differences in water requirements between surface (j =
1) and pressurised (j = 2) irrigation methods.
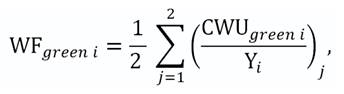
Where
WFgreen i represents the average green WF in the i-th
microregion, taking into account both surface and pressurised irrigation
systems; CWUgreen i is the green CWU in the i-th
microregion; Yi is the yield per hectare in the i-th
microregion; and j is the irrigation method, ranging from 1 to 2 (specifying, j
= 1surface and j =2 pressurised irrigation systems).
Then, the average values for both the blue and green WF were
calculated at the oasis level, formally:
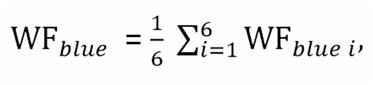
Where
WFblue represents the average blue WF at oasis level; WFblue
i the blue WF in the i-th microregion; and i the
microregion, ranging from 1 to 6. Each i represents a distinct
microregion within the oasis.
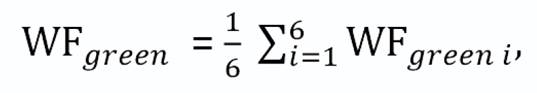
Where
WFgreen represents the average green WF at oasis level; WFgreen
i the green WF in the i-th microregion; and i the
microregion, ranging from 1 to 6. Each i represents a distinct
microregion within the oasis.
Once
the average values for the blue WF (m3 tonne-1) were
calculated at the oasis level (Equation 4), the water
availability for other uses (WAOU1policy site) in
the oasis was derived from Equation (6):
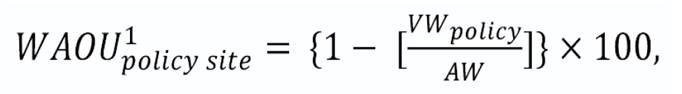
Where
WAOU1policy site represents the average annual
percentage of water availability for other uses that could be achieved at the
policy site, if the water distribution system were aligned with the water
requirements of grapevine crops; VWpolicy corresponds to the
average annual volume of water allocated to viticulture in the oasis (m3
year-1); and AW (agricultural water) is the average annual volume of
water allocated to agricultural use (m3 year-1).
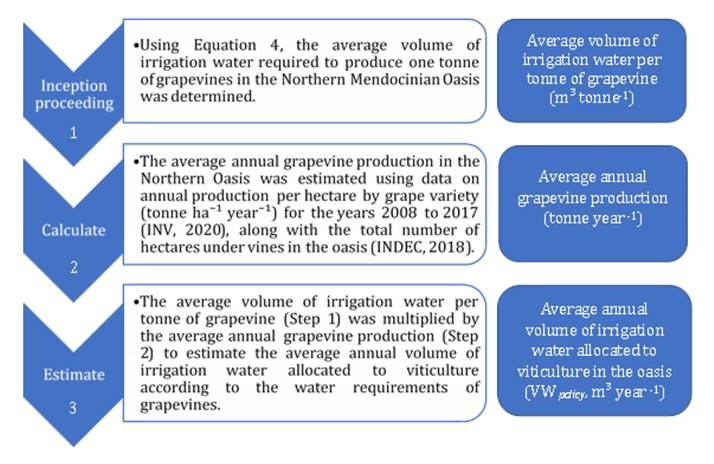
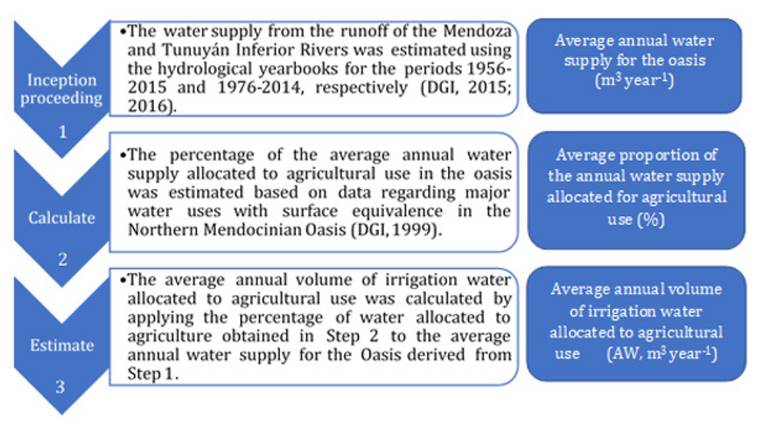
Figure 3 and figure 4, illustrate the
respective processes used to estimate the average annual irrigation water
volumes allocated to viticulture (VWpolicy, m3
year-1) and agriculture (AW, m³ year-1) in the oasis.
Source:
Own elaboration.
Fuente:
Elaboración propia.
Figure
3. Process for estimating the average annual volume of
irrigation water allocated to viticulture in the Mendocinian Northern Oasis.
Figura
3. Proceso para estimar el volumen
promedio anual de agua de riego asignado a la viticultura en el Oasis Norte de
Mendoza.
Source:
Own elaboration.
Fuente:
Elaboración propia.
Figure
4. Process for estimating the average annual volume of
irrigation water allocated for agricultural use in the Mendocinian Northern
Oasis.
Figura
4. Proceso para estimar el volumen
promedio anual de agua de riego asignado al uso agrícola en el Oasis Norte de
Mendoza.
Next,
we calculated the current average annual water availability for other uses in
the policy site, formally:
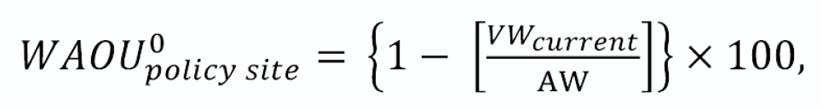
Where
WAOU0policy site represents the average annual
percentage of current water availability for other uses in the policy site; VWcurrent
(Equation 8) is the current average annual volume of
water allocated to viticulture (m3 year-1); and AW is the
average annual volume of water allocated to agricultural use (m3
year-1) in the oasis.
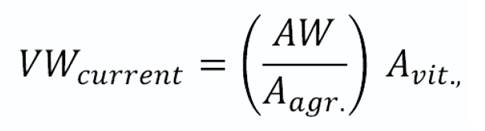
Where
VWcurrent represents the current average annual volume of
water allocated to viticulture in the policy site; AW is the average annual
volume of water allocated to agricultural use (m3 year-1);
Avit. (ha) is the area under vines in the oasis; and Aagr. (ha) is the total
cultivated area in the oasis (INDEC, 2018).
We
then calculated the percentage points that could be reallocated from vineyards
to other uses in the oasis. This was based on increased water availability and
its subsequent reallocation following the implementation of a water security
improvement policy (Equation 9).

Where
E [ ∆ W A] denotes the expected
change in average annual water availability resulting from the water security
improvement policy; WAOU1policy site is the
average annual percentage of water availability for other uses that could be
achieved in the policy site if the water distribution system were aligned with
the water requirements of grapevine crops; and WAOU0policy
sity is the average annual percentage of current water availability
for other uses in the policy site.
Finally,
we estimated the TEV of a water security improvement policy in the Mendocinian
Northern Oasis by applying Equation (10):

Where E [ ∆ W A] is the expected change in
average annual water availability resulting from water security improvement
policies; and WTPpolicy site is the value of a marginal
change in water security -achieved through a policy that conserves agricultural
water for reallocation to other uses- adjusted to the conditions of the policy
site.
Results and Discussion
The results follow five methodological stages to predict the TEV
of a water security improvement policy in the Mendocinian Northern Oasis (figure 2). The practical implications of these results are
discussed in the context of water security management, focusing on efficient
agricultural water allocation and conservation strategies.
Value
of a Marginal Change in Water Security Adjusted to the Conditions of the Policy
Site
According to Rosenberger and Loomis (2003) and Johnston
et al. (2021), the study site was selected for its similarity to the
policy site in four categories. These categories are: (i) socio-economic
characteristics, (ii) biophysical conditions, (iii) proposed environmental
changes, and (iv) economic valuation objectives.
A comprehensive
literature review was then conducted to identify potential study sites that met
these criteria. This process led to the selection of the study by Farreras and Abraham (2020). They estimated the welfare
effects of adapting viticultural management practices to climate change in the
Mendocinian Northern Oasis. The study applied the discrete choice experiment
(DCE) method, a valuation technique consistent with welfare economic theory (Bennett and Blamey, 2001). This method relies on
society’s stated maximum WTP to avoid or accept a marginal change in the
quantity or quality of an environmental good’s attribute. This is achieved
through the design of hypothetical markets presented via questionnaires.
Additionally, the use of the DCE at the study site allows for the identification
of marginal values for specific environmental attributes and has been shown to
perform better than other economic valuation methods when benefit transfers are
required (Hanley et al., 1998).
Surveys at the
study site were conducted in spring 2017. A representative sample of citizens
of the Northern Oasis of Mendoza was interviewed. The sample consisted of
randomly selected individuals aged between 24 and 80 years, all residing in
cities with populations of over 10,000 inhabitants. Approximately 90% of those
approached agreed to be interviewed. The interviews were conducted face-to-face
in the respondents’ homes, resulting in 678 valid observations.
Environmental
Attributes and Levels Used at the Study Site
The study valued
three attributes related to adapting vineyard practices to climate change in
Mendoza: (1) water availability for other uses, (2) use of chemical
fertilisers, and (3) use and conservation of biodiversity. Given the objective
of this study, the primary attribute of interest is the availability of water
for other uses.
The attribute had
four levels-41% (business-as-usual, BAU), 53%, 65%, and 76%. These represent
the average water available in 30 years for other uses: industry, public areas
(green spaces, urban trees), and irrigation of non-vineyard crops. These levels
ranged from the value expected under a BAU scenario to values above the BAU
level. The BAU level shows the situation projected in 30 years from now under
non-adaptive management practices in Mendocinian vineyards. Other levels show
potential outcomes from adapting viticultural practices to climate change.
Marginal
Benefit or Value to Be Transferred
The study by Farreras and Abraham (2020) estimated that a
representative citizen of the Mendocinian Northern Oasis was, on average,
willing to pay 13.05 (95% CI: 6.24-27.28) Argentine pesos [0.74 (95% CI:
0.35-1.55) US dollars] per household annually for an additional percentage
point in water availability for other uses, at 2017 prices subject to
adjustment for inflation, over the next 30 years. Figures in parentheses
indicate the limits of the 95% confidence interval.
Adjustment
Process
We adjusted the
estimated values at the study site to align with the conditions of the policy
site, following the methodology of Rolfe et al. (2015).
Their study demonstrated that transferring values between similar sites
requires straightforward adjustments. Since the study and policy sites
coincide, inflation was the adjustment factor used to align information and
ensure accurate value estimates for the policy site.
Adjustment
for Inflation
The estimated
values at the study site were adjusted using the Consumer Price Index (CPI).
This adjustment accounts for inflation between the interview period (September
2017) and November 2024 (Equation 1). The accumulated
inflation over this period was 6,393% (INDEC, 2024).
Therefore, a representative citizen of the Mendocinian Northern Oasis is
estimated to be, on average, willing to pay 847.34 (95% CI: 405.16-1,771.29)
Argentine pesos [0.83 (95% CI: 0.40-1.74) US dollars] per household annually
for an improvement in water security equivalent to an additional percentage
point in water availability for other uses, at 2024 prices over the next 30
years. Average exchange rate in November 2024: 1 US dollar equals 1,019.56
Argentinean pesos.
Average
Annual Water Availability for Other Uses Based on a Water Distribution System
Aligned with the Water Requirements of Grapevine Crops in the Policy Site
Using
meteorological, grapevine, and soil data, we estimated the blue and green WF of
vineyards at the microregional level by applying Equation (2),
and Equation (3), respectively. Figure 5A,
depicts the blue and green WF for each of the six microregions within the
Northern Oasis of Mendoza.
Source:
Own elaboration.
Fuente:
Elaboración propia.
Figure
5. Blue and green WF (m3 tonne-1)
(A) for each of the six microregions and (B) for the Mendocinian Northern
Oasis.
Figura
5. Huella hídrica azul y verde (m3
tonelada-1) (A) para cada una de las seis microrregiones y (B) para
el Oasis Norte de Mendoza.
Given that the crop
requires more water than is provided by rainfall, the deficit is compensated
through irrigation. As a result, the blue WF exceeded the green WF across all
microregions. The Jocolí microregion had the highest blue WF, at 795 m3
tonne-1,
while the Medrano microregion had the lowest, at 437 m3 tonne-1.
The variations in
WF across microregions result from a variety of factors, including local
climate conditions and agricultural management practices. This information may
be particularly useful for stakeholders involved in promoting efficient water
allocation and conservation strategies. For instance, a decision-maker may
prioritise water distribution based on specific crops’ water requirements. The
analysis of the WF enables the design of distribution schemes tailored to these
local needs. In this context, for the same crop and irrigation system,
microregions with higher WF need more water than those with lower footprints.
If resource distribution aligns with irrigation water demand, it becomes possible
to reduce water deliveries in certain microregions without compromising
agricultural productivity or associated ecosystems. This approach increases
water availability at the oasis scale, enabling more efficient resource
reallocation and strengthening long-term water security without sacrificing
productivity or ecosystem integrity (Grafton et al.,
2018).
Meanwhile, the
Mendocinian Northern Oasis averages 682 m³/tonne blue WF (Equation
4) and 126 m³/tonne green WF (Equation 5), as shown in figure 5B). This highlights the dominance of irrigation water
over effective rainfall in meeting the vineyard water requirements in this
region.
These results
partially align with previous findings in the literature. For example, Civit et al. (2018) estimated that the blue WF
for the most important varietals in the five wine-producing regions of Mendoza
ranges from 540.53 m³ tonne-¹
to 1,020.03 m³ tonne-¹.
On a global scale, Mekonnen and Hoekstra (2011)
reported an average blue WF of 608 m³ tonne-¹
in viticulture production for the period 1996-2005. Similarly, Herath et al. (2013) documented blue WFs of 601
m³ tonne-1 and 611 m³ tonne-¹ in vineyards in
the Gisborne and Marlborough regions of New Zealand, respectively. These
findings emphasise reliance on irrigation in viticulture. About 84% of vineyard
water needs were met through irrigation during the analysed period. This
underscores the need for sustainable water resource management.
We estimated that, under a water distribution system aligned
with the grapevine crops’ water requirements, 69% of water could, on average,
be available annually for other uses (Equation 6; figure 6A). This estimate is based on the average annual water
volumes allocated to viticulture (figure 3) and agriculture (figure 4).
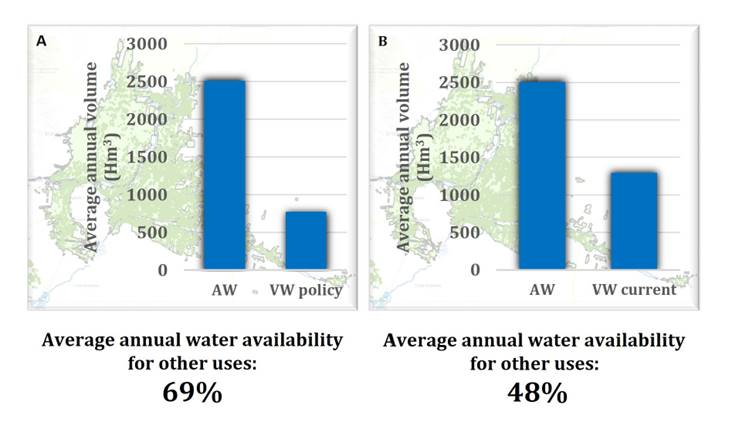
Figure
6. Average annual percentage of water availability for
other uses in the Mendocinian Northern Oasis estimated under (A) the
implementation of a water security improvement policy and (B) the current water
management.
Figura
6. Porcentaje promedio anual de
disponibilidad hídrica para otros usos en el Oasis Norte de Mendoza estimado
bajo (A) la implementación de una política de mejora de la seguridad hídrica y
(B) la gestión hídrica actual.
Current
Average Water Availability for Other Uses in the Policy Site
We
estimated that, on average, 48% of water is currently available annually for
other uses in the Mendocinian Northern Oasis (Equation 7; figure 6B). This estimate is based on current average annual
water volumes allocated to viticulture (Equation 8)
and agriculture (figure 4).
Expected
Change in Average Annual Water Availability Due to a Water Security Improvement
Policy
Next, we estimated
the average percentage points of irrigation water that could be reallocated
from vineyards to other uses under a water security improvement policy (Equation 9). The average reallocation was estimated at 21
percentage points. This volume could be redistributed to industry, municipal
spaces (green areas, urban trees), and irrigation of non-viticultural crops.
Total
Economic Value of a Water Security Improvement Policy in the Policy Site
Assuming unitary
price elasticity, the TEV of reallocating an average of 21 percentage points of
water from vineyards to other uses can be estimated. This is calculated by
multiplying the 21-percentage-point change by the value of a
one-percentage-point increase in water availability for other uses.
Applying Equation (10), a water security policy that increases average
annual water availability for other uses by 21 percentage points corresponds to
an average household welfare gain of ARS 17,794.14 [USD 17.43] per year at 2024
prices (95% CI: ARS 8,508.36-37,197.09 [USD 8.40-36.54]) over the next 30
years.
Direct comparisons
are difficult due to differing units used to estimate WTP (e.g., per
hectare, time horizon). However, this finding aligns with Pellegrini
et al. (2023), who estimated social welfare changes associated with
improvements in specific water security components. Based on their literature
review, they reported households’ willingness to pay between 9.68 and 209.66 US
dollars per year for water purification services. For biodiversity habitat
conservation, willingness to pay ranged from 17.23 to 106.40 US dollars. For
cultural services such as aesthetic and recreational benefits, willingness to
pay ranged from 17.23 to 156.99 US dollars. WTP in the study of Pellegrini et al. (2023) are expressed in Euros.
We expressed them in US dollars using the average 2023 daily Euro - USD
exchange rate published, 1.08268509, by www.macrotrends.net
Our study adopts a
comprehensive approach to value a water security improvement policy, explicitly
addressing water reallocation to alternative uses. This analysis helps fill a
gap by providing a broader perspective that accounts for welfare associated
with overall water security enhancement.
Conclusions
Globally, many
regions face severe water scarcity, worsened by global changes increasing
uncertainty and variability in water availability. In this context, a paradigm
shift in water resource management is crucial. Aligning water allocation with
crop requirements improves management efficiency and strengthens long-term
water security, while protecting agricultural productivity and the integrity of
ecosystems. Understanding the benefits of such strategies is essential for
their successful implementation. This study addresses this gap by estimating
the changes in social welfare resulting from improved water security.
A distinctive
contribution of our study lies in the estimation of social welfare changes
resulting from water security improvements, expressed in monetary terms. This information
is particularly valuable for decision-makers, policymakers, and natural
resource managers. For example, with a fixed budget for a water security
improvement policy, decision-makers can evaluate whether the costs outweigh the
monetary benefits provided to citizens. Similarly, this estimation allows
policymakers to allocate resources efficiently and justify major water security
reforms to stakeholders and the public by emphasising socio-economic benefits.
Our
study found that the TEV of a water security improvement policy in the Northern
Mendocinian Oasis -resulting in a 21-percentage-point average increase in the
annual water availability for other uses- is equivalent to an average household
welfare gain of ARS 17,794.14 [USD 17.43] per year at 2024 prices (95% CI: ARS
8,508.36-37,197.09 [USD 8.40-36.54]) over the next 30 years.
These findings
offer decision-makers a robust basis for assessing the costs and benefits of
investments in water security, thereby enabling more informed public policy
decisions.
Following the
guidance of experts in BTM, the method was carefully applied to ensure a
state-of-the-art implementation. Recognising that transfer errors often arise
from differences between study and policy sites, we prioritised ensuring
similarity across four categories: (i) socio-economic characteristics, (ii)
biophysical conditions, (iii) proposed environmental changes, and (iv) economic
valuation objectives. This approach aimed to minimise transfer errors and
establish benefit transfer as a robust tool for obtaining the TEV of a water
security improvement policy.
Nevertheless, data
limitations led to restrictive assumptions. For instance, the estimation of
water reallocation from vineyards to other uses relied solely on surface water
data. This may have resulted in an underestimation of the policy’s TEV.
Similarly, the WF estimation of vineyards did not account for inefficiencies in
the irrigation system, potentially leading to an overestimation of the policy’s
TEV. Therefore, our results should be interpreted as approximations, within the
context of these limitations.
In
summary, this study demonstrates that social welfare is expected to increase
through the implementation of water security improvement policies. It provides
a framework for regions worldwide where irrigation water is a common resource
facing challenges like water scarcity, rising water demand, and climate change.
By assessing social welfare effects of an improvement in water security, it
offers critical insights for decision-makers, policymakers, and resource
managers in comparable global contexts. These insights support the design of
more informed water management strategies, ensuring long-term water security.
Acknowledgements
We
sincerely thank the two anonymous referees for their valuable contributions,
which have greatly improved the quality of this article. We also acknowledge
the support of the Secretaría de Investigación, Internacionales y Posgrado
(SIIP) at Universidad Nacional de Cuyo through project SIIP: 06/D006-T1.
Allen, R. G.,
Pereira, L. S., Raes, D. & Smith, M. (1998). Crop evapotranspiration:
Guidelines for computing crop water requirements (FAO Irrigation and
Drainage Paper N° 56). Food and Agriculture Organization of the United Nations.
Bennett, J. &
Blamey, R. (2001). The choice modelling approach to environmental valuation (p.
269). Edward Elgar Publishing.
Boutwell, J. L.
& Westra, J. V. (2013). Benefit transfer: A review of methodologies and
challenges. Resources, 2(4), 517-527.
https://doi.org/10.3390/resources2040517
Carson, R. T.,
Carson, N., Alberini, A., Flores, N. & Wright, J. (1993). A bibliography
of contingent valuation studies and papers. Natural Resources Damage
Assessment.
Castex, V., Morán,
E. & Beniston, M. (2015). Water availability, use and governance in the
wine producing region of Mendoza, Argentina. Environmental Science &
Policy, 48, 1-8. https:// doi.org/10.1016/j.envsci.2014.12.008
Civit, B.,
Piastrellini, R., Curadelli, S. & Arena, A. P. (2018). The water consumed
in the production of grapes for vinification (Vitis vinifera): Mapping
the blue and green water footprint. Ecological Indicators, 85, 236-243.
Dirección de
Agricultura y Contingencias Climáticas. (2021). Informe técnico [Dataset].
Departamento
General de Irrigación. (1999). Plan hídrico para la provincia de Mendoza.
Bases y propuestas para el consenso de una política de estado. Gobierno de
Mendoza.
Departamento
General de Irrigación. (2015). Balance hídrico río Tunuyán Inferior (Cap.
5, p. 129).
Departamento
General de Irrigación. (2016a). Balance hídrico río Mendoza (Cap. 4, p.
128).
Departamento
General de Irrigación. (2016b). Aquabook. http://aquabook.agua.gob.ar/
Duek, A. E. (2018).
Escenarios de uso sostenible del recurso hídrico en el sector agrícola de
Mendoza. 4° Encuentro de Investigadores en Formación en Recursos Hídricos,
11. https://www.ina. gov.ar/ifrh-2018/pdf/IFRH_2018_paper_4.pdf
Farreras, V.,
Riera, P., & Salvador, P. F. (2017). Environmental valuation with
periodical payments in high-inflation economies: An Argentinean case study. Ecological
Economics, 138, 56-63. https://doi.org/10.1016/j.ecolecon.2017.03.028
Farreras, V., &
Abraham, L. (2020). Valuation of viticultural adaptation to climate change in
vineyards: A discrete choice experiment to prioritize trade-offs perceived by
citizens. Wine Economics and Policy, 9(2), 99-112.
Food and
Agriculture Organization of the United Nations. (2024). CROPWAT 8.0 for
Windows [Computer software]. https://www.fao.org/land-water/databases-and-software/cropwat/en/
Grafton, R. Q.,
Williams, J., Perry, C. J., Molle, F., Ringler, C., Steduto, P., Udall, B.,
Wheeler, S. A., Wang, Y., Garrick, D., & Allen, R. G. (2018). The paradox
of irrigation efficiency. Science, 351, 748-750.
Hanley,
N., Wright, R. E., & Adamowicz, V. (1998). Using choice experiments to
value the environment. Environmental and Resource Economics, 11:
413-428. https://doi. org/10.1023/A:1008287310583
Herath, I., Green,
S., Singh, R., Horne, D., van der Zijpp, S., & Clothier, B. (2013). Water
footprinting of agricultural products: A hydrological assessment for the water
footprint of New Zealand’s wines. Journal of Cleaner Production, 41, 232-243.
Hoekstra, A. Y.,
Chapagain, A. K., Aldaya, M. M., & Mekonnen, M. M. (2011). The water
footprint assessment manual: Setting the global standard. Routledge.
https://waterfootprint.org/
resources/TheWaterFootprintAssessmentManual_English.pdf
Instituto Nacional
de Estadísticas y Censo. (2018). Censo Nacional Agropecuario 2018. Cuadros
estadísticos. https://www.indec.gob.ar/indec/web/Nivel4-Tema-3-8-87
Instituto Nacional
de Estadísticas y Censo. (2024). [Dataset].
https://www.indec.gob.ar/ftp/cuadros/ economia/sh_ipc_12_24.xls
Instituto Nacional
de Tecnología Agropecuaria. (1990). Atlas de Suelos de la República
Argentina.
Instituto Nacional
de Vitivinicultura. (2020). Relevamiento Vitivinícola Argentino-Sector
Primario. https://www.argentina.gob.ar/inv/vinos/estadisticas/regiones-vitivinicolas
Johnston, R. J.,
Boyle, K. J., Loureiro, M. L., Navrud, S., & Rolfe, J. (2021). Guidance to
enhance the validity and credibility of environmental benefit transfers. Environmental
and Resource Economics, 79, 575-624. https://doi.org/10.1007/s10640-021-00574-w
Katz, D. (2016).
Undermining demand management with supply management: Moral hazard in Israeli
water policies. Water, 8(4), 159. https://doi.org/10.3390/w8040159
Konapala, G.,
Mishra, A. K., Wada, Y., & Mann, M. E. (2020). Climate change will affect
global water availability through compounding changes in seasonal precipitation
and evaporation. Nature Communications, 11, 3044.
https://doi.org/10.1038/s41467-020-16757-w
Lauro, C., Vich, A.
I. J., Otta, S., Moreiras, S. M., Vaccarino, E., & Bastidas, L. (2021).
Recursos hídricos superficiales de la vertiente oriental de los Andes Centrales
(28°-37°S) en contexto de variabilidad hidroclimática. Boletín de Estudios
Geográficos, 116, 45-71.
Lauro, C., Vich, A.
I. J., Rivera, A., Otta, S., Moreiras, S. M., Bastidas, L., & Vaccarino, E.
(2022). Patrones de variabilidad hidroclimática en los Andes Centrales
(30-37°S) de Argentina. Geoacta, 44(1), 1-22.
Mekonnen, M., &
Hoekstra, A. Y. (2011). The green, blue and grey water footprint of crops and
derived crop products. Hydrology and Earth System Sciences, 15(5),
1577-1600. https://doi. org/10.5194/hess-15-1577-2011
Monnet, M.,
Vignola, R., & Aliotta, Y. (2022). Smallholders’ water management decisions
in the face of water scarcity from a socio-cognitive perspective: Case study of
viticulture in Mendoza. Agronomy, 12(11), 2868.
https://doi.org/10.3390/agronomy12112868
Morábito, J.,
Mirábile, C., Salatino, S., Pizzuolo, P., Chambouleyron, J., & Fasciolo, G.
(2005). Eficiencia de riego actual y potencial en el área regadía del río
Mendoza. https://repositorio.ina.gob.ar/
items/cd398433-7fa6-4b9c-adb9-0b7ebc2dcb97
Morábito, J.,
Mirábile, C., & Salatino, S. (2007). Eficiencia del riego superficial,
actual y potencial, en el área de regadío del río Mendoza (Argentina). Ingeniería
del Agua, 14, 199-214. https:// doi.org/10.4995/ia.2007.2912
Pellegrini, E.,
Dalmazzone, S., Fasolino, N. G., Frontuto, V., Gizzi, P., Luppi, F., Moroni,
F., Raggi, M., Zanni, G., & Viaggi, D. (2023). Economic analysis under the
Water Framework Directive: The state of the art and way forward. Water, 15(23),
4128. https://doi.org/10.3390/w15234128
Pérez Blanco, C.
D., Hrast Essenfelder, A., & Perry, C. (2020). Irrigation technology and
water conservation: A review of the theory and evidence. Review of
Environmental Economics and Policy, 14(2).
Rivera, J. A.,
Naranjo Tamayo, E., & Viale, M. (2020). Water resources change in
Central-Western Argentina under the Paris Agreement warming targets. Frontiers
in Climate, 2, 587126. https://doi.org/10.3389/fclim.2020.587126
Rivera, J., Lauro,
C., & Otta, S. (2021). Cuantificación del déficit hidrológico reciente en
la región de Cuyo a partir de indicadores de caudales bajos. Boletín de
Estudios Geográficos, 116, 23-44.
Rodríguez, J., De
la Iglesia, F., & Ocvirk, M. (2000). Fenología de cultivares de vid (Vitis
vinífera L.) en Luján de Cuyo. Revista de la Facultad de Ciencias
Agrarias, 32(2), 15-24. http://bdigital. uncu.edu.ar/11001
Rolfe, J., Windle,
J., & Johnston, R. J. (2015). Applying benefit transfer with limited data:
Unit value transfers in practice. In R. J. Johnston, J. Rolfe, R. S.
Rosenberger, & R. Brouwer (Eds.), Benefit transfer of environmental and
resource values: A guide for researchers and practitioners (p. 381-398).
Springer.
Rosenberger, R.,
& Loomis, J. (2003). Benefit transfer. In P. Champ, K. Boyle, & T.
Brown (Eds.), A primer on nonmarket valuation (p. 445-482). Kluwer
Academic Publishers.
Servicio
Meteorológico Nacional. (2024). Estadísticas climatológicas normales período
1991–2020. https://www.smn.gob.ar/descarga-de-datos
United States
Department of Agriculture. (2024). Soil water characteristics (Version
6.02.72) [Computer software]. https://www.ars.usda.gov/research/software/
download/?softwareid=492&modecode=80-42-05-10
Villodas, R.,
Andino, M., Baduí, M. T., & Marinelli, S. (2023). Distribución de riego en
función de la demanda-cuenta de agua. XXVII Congreso Nacional del Agua,
Buenos Aires, Argentina.
Zetland,
D. (2021). The role of prices in managing water scarcity. Water Security, 12,
100081. https:// doi.org/10.1016/j.wasec.2020.100081